Century 21 People’s Choice Realty Inc., Brokerage
120 MATHESON BLVD E #103
MISSISSAUGA, Ontario
L4Z 1X1


Zorra, Thamesford, N0M 2M0
$787,900
Listed by Century 21 First Canadian Corp Inc.
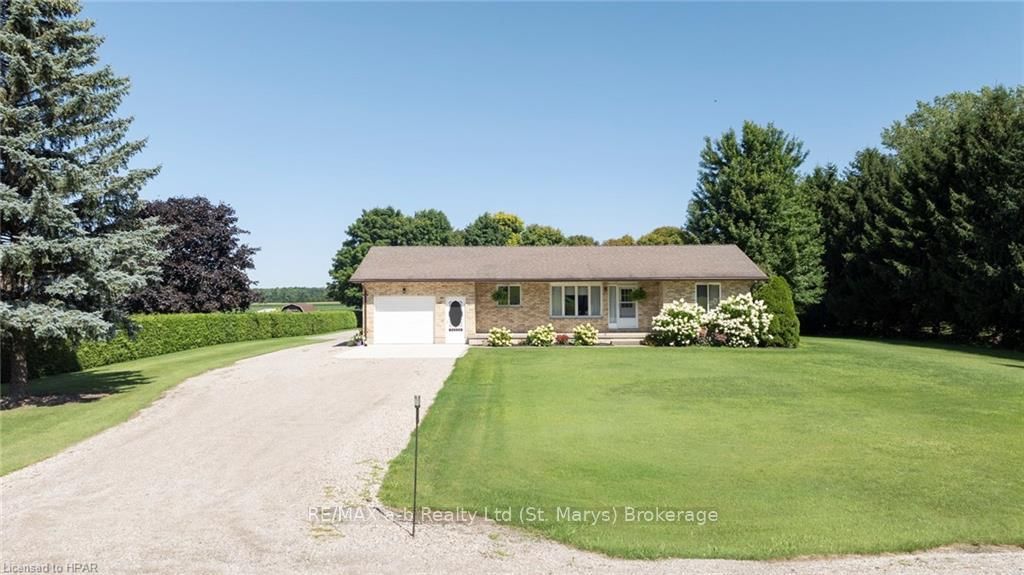
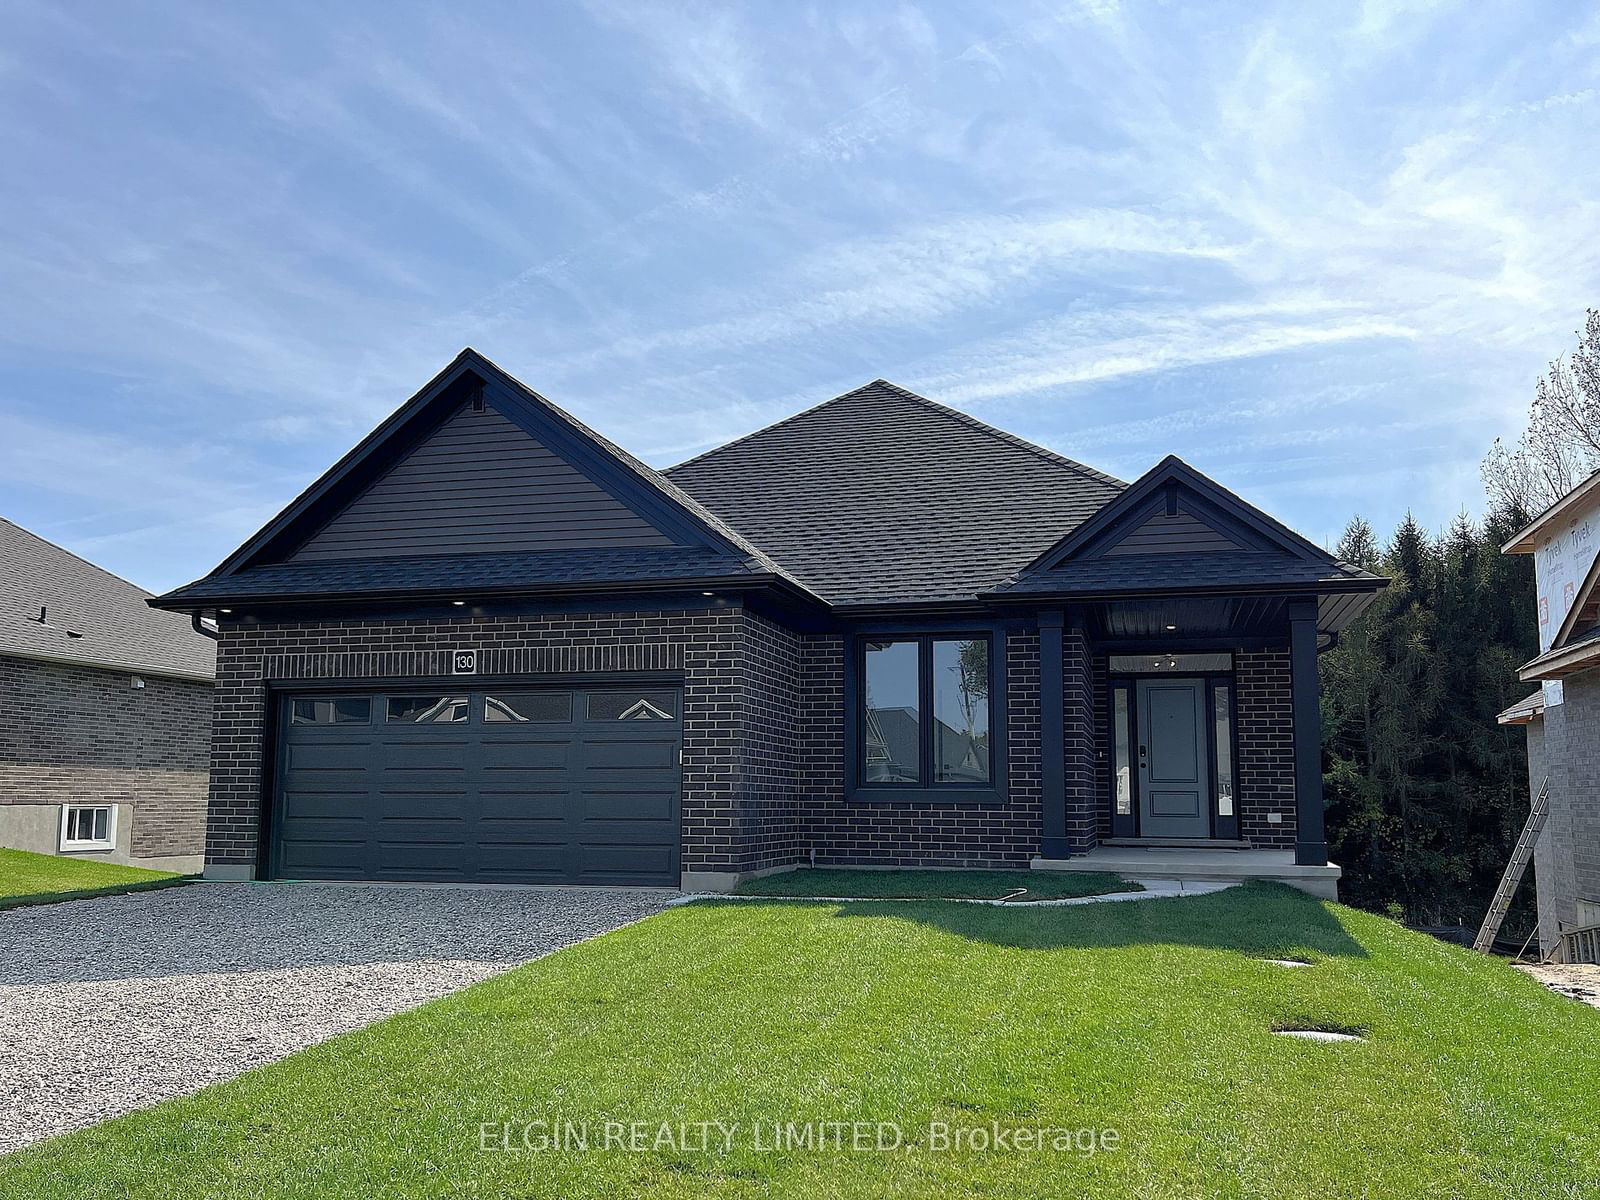
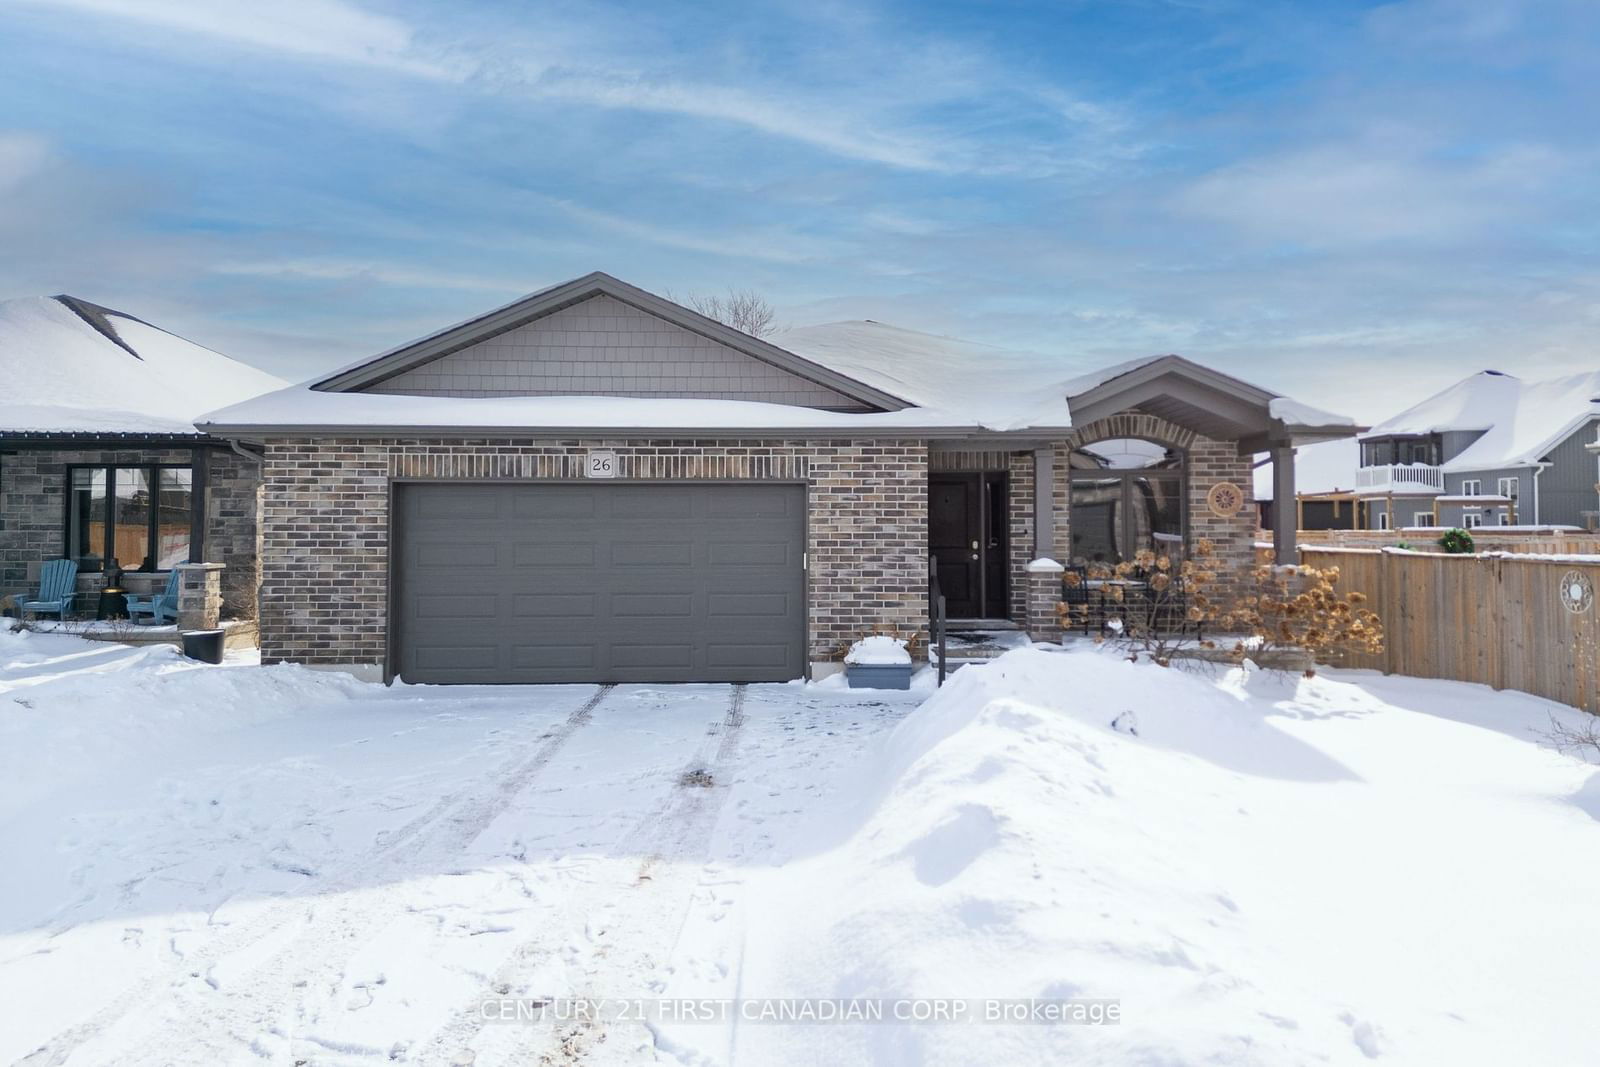
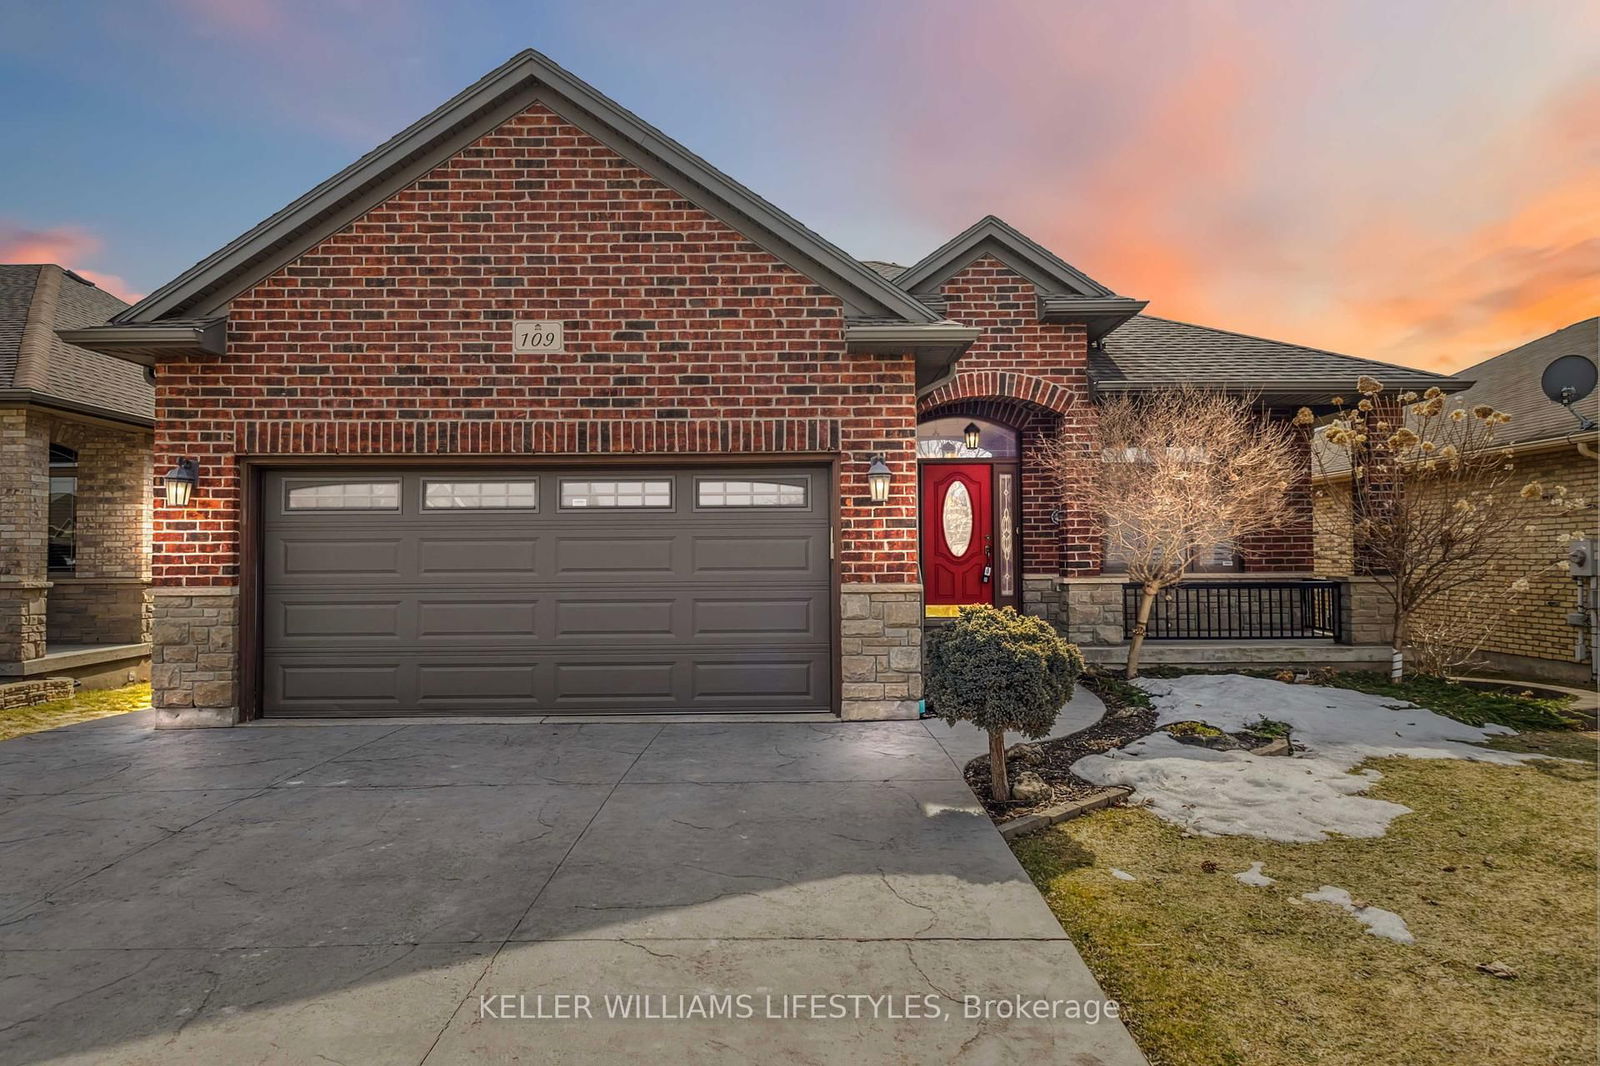
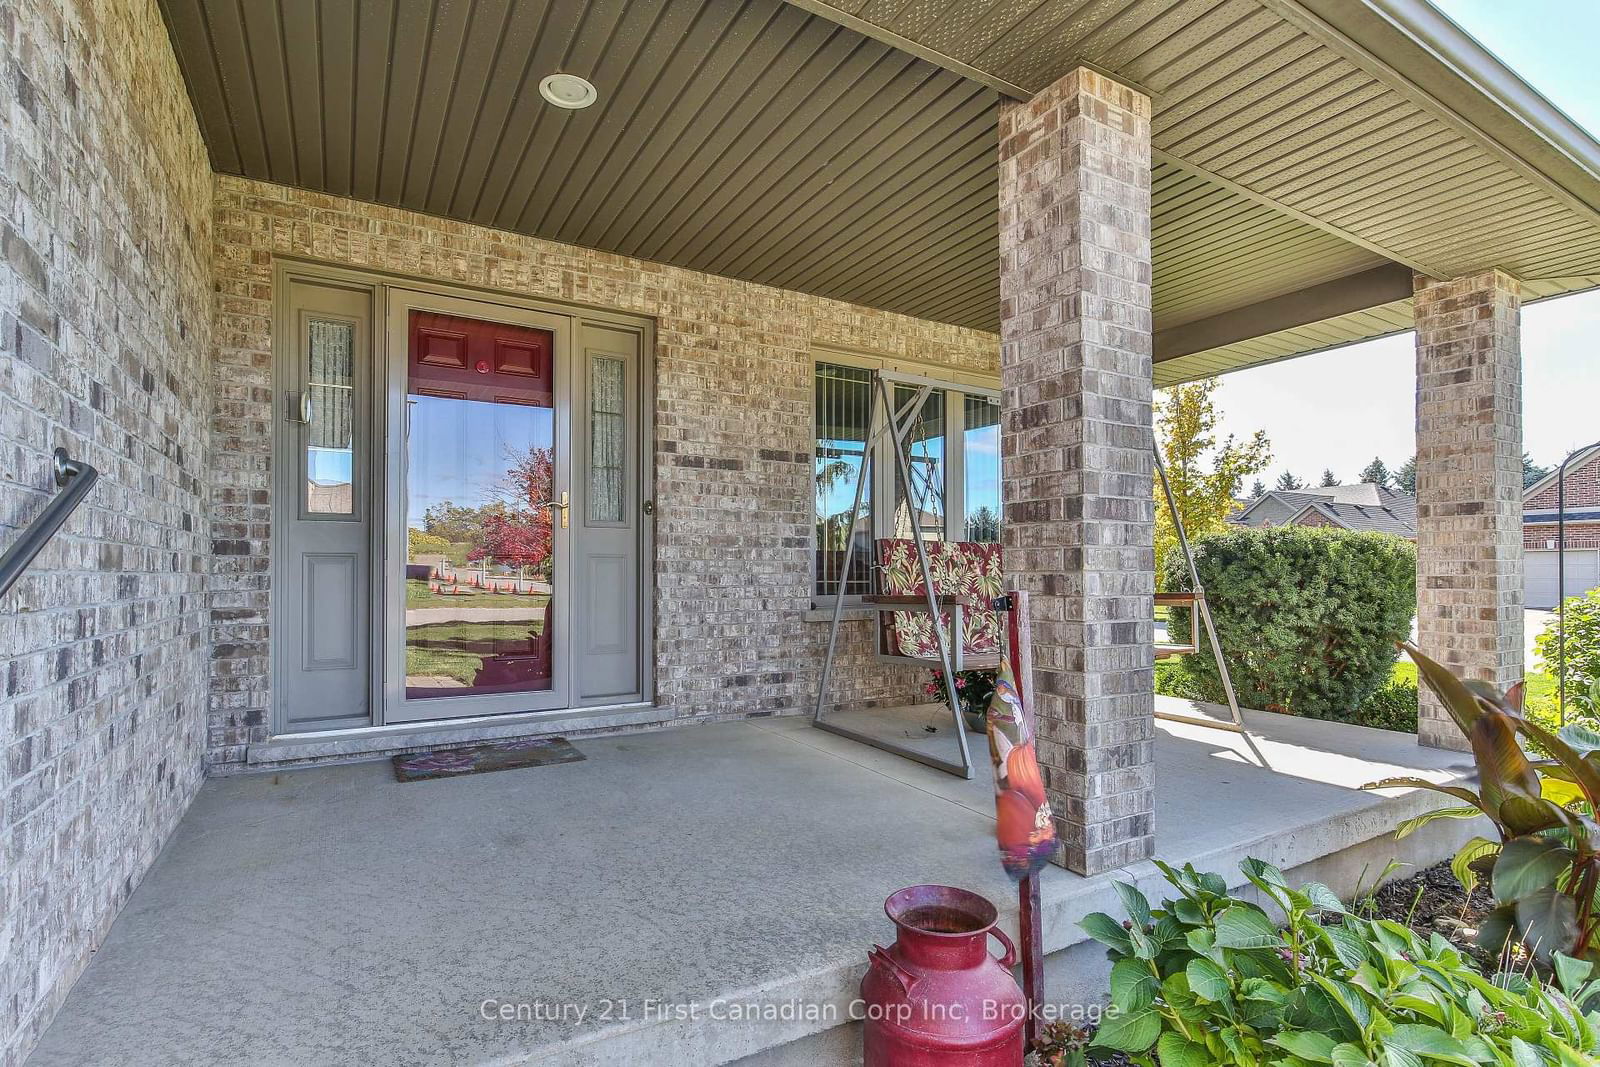
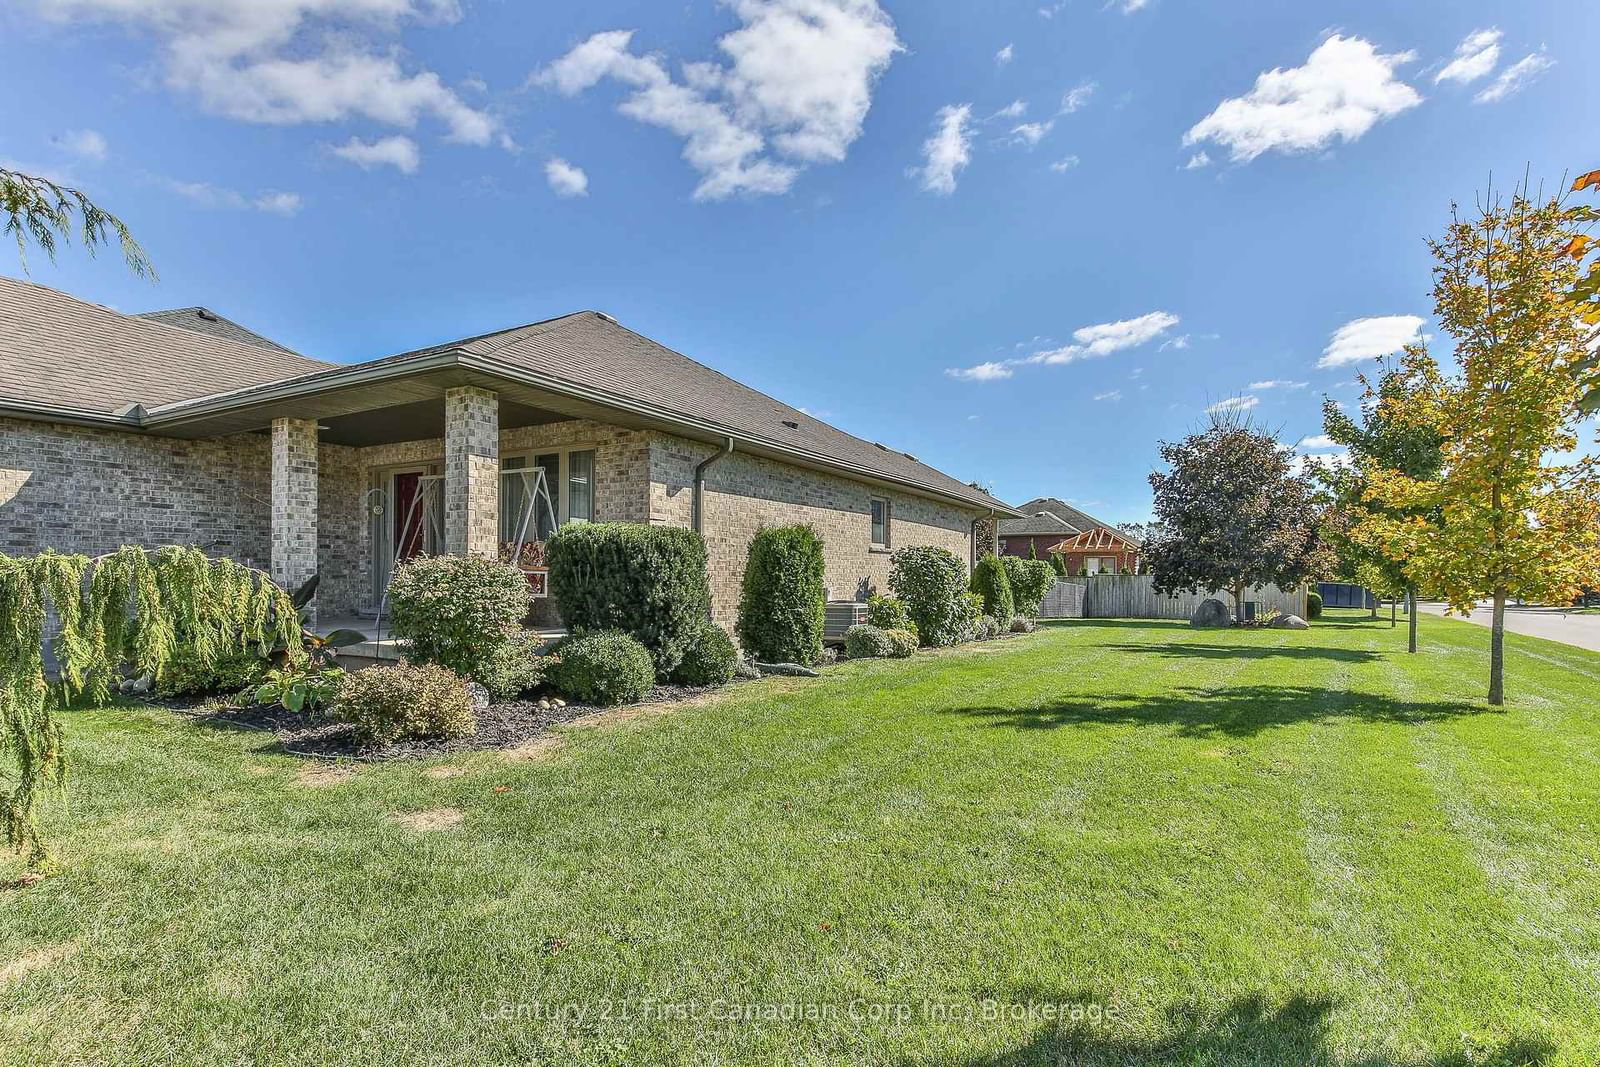
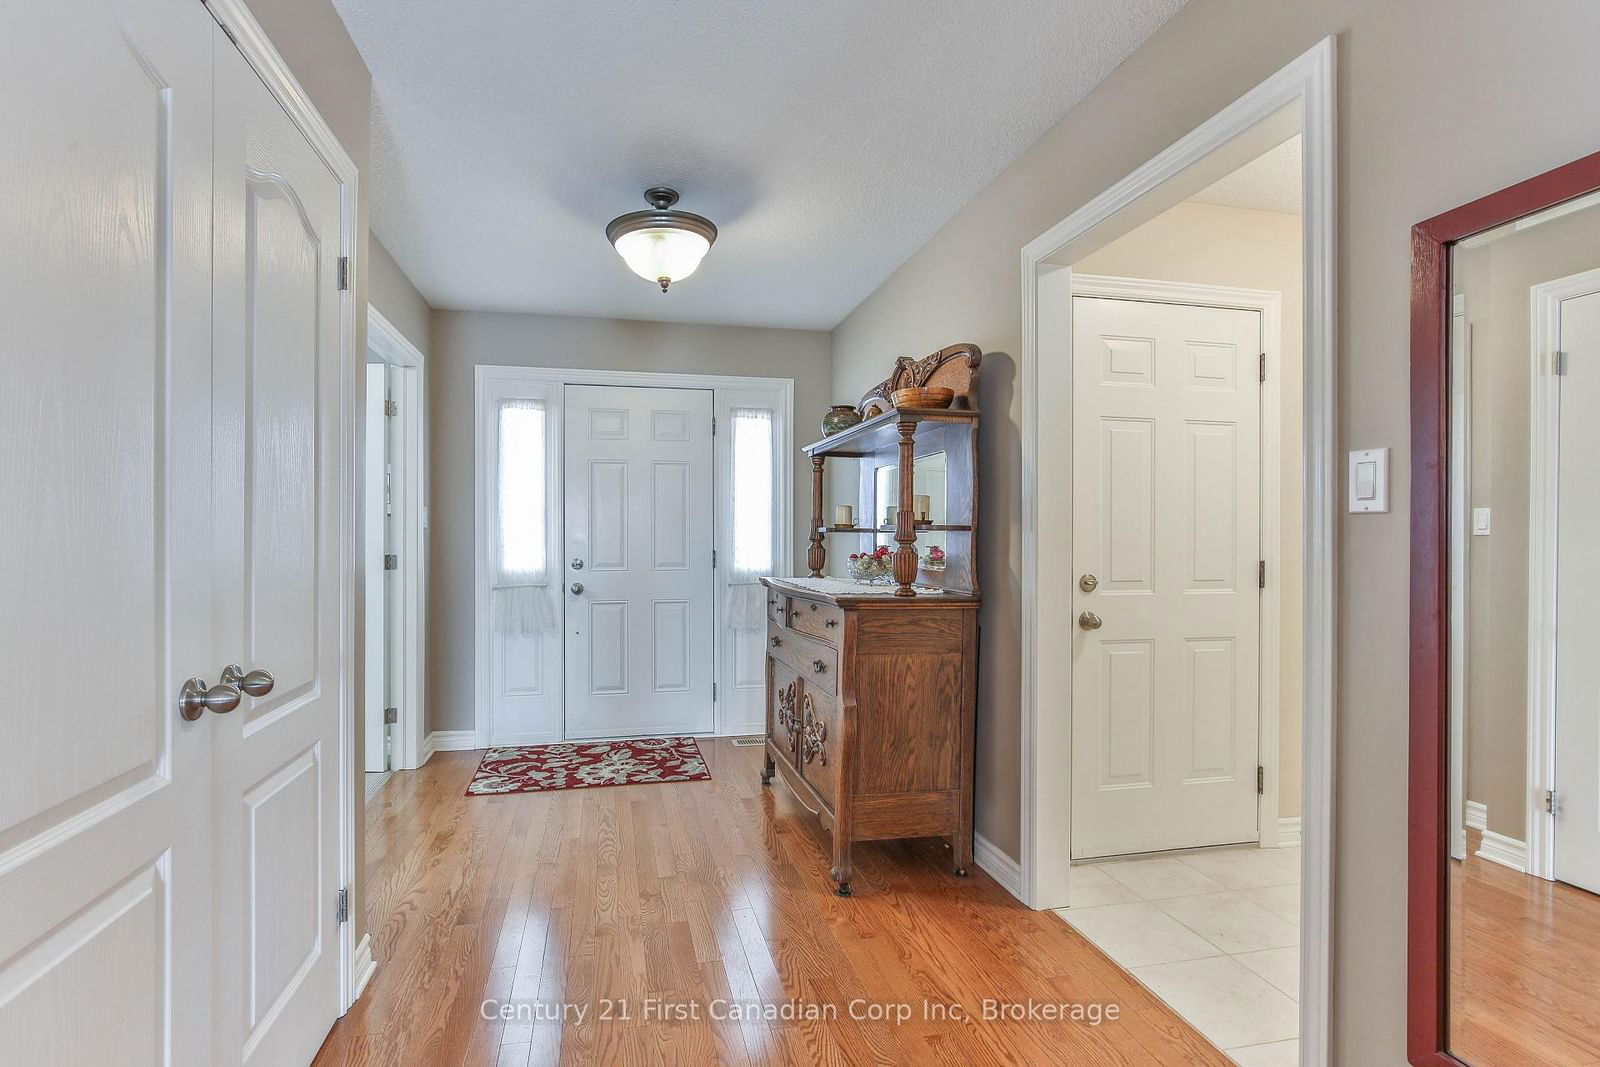
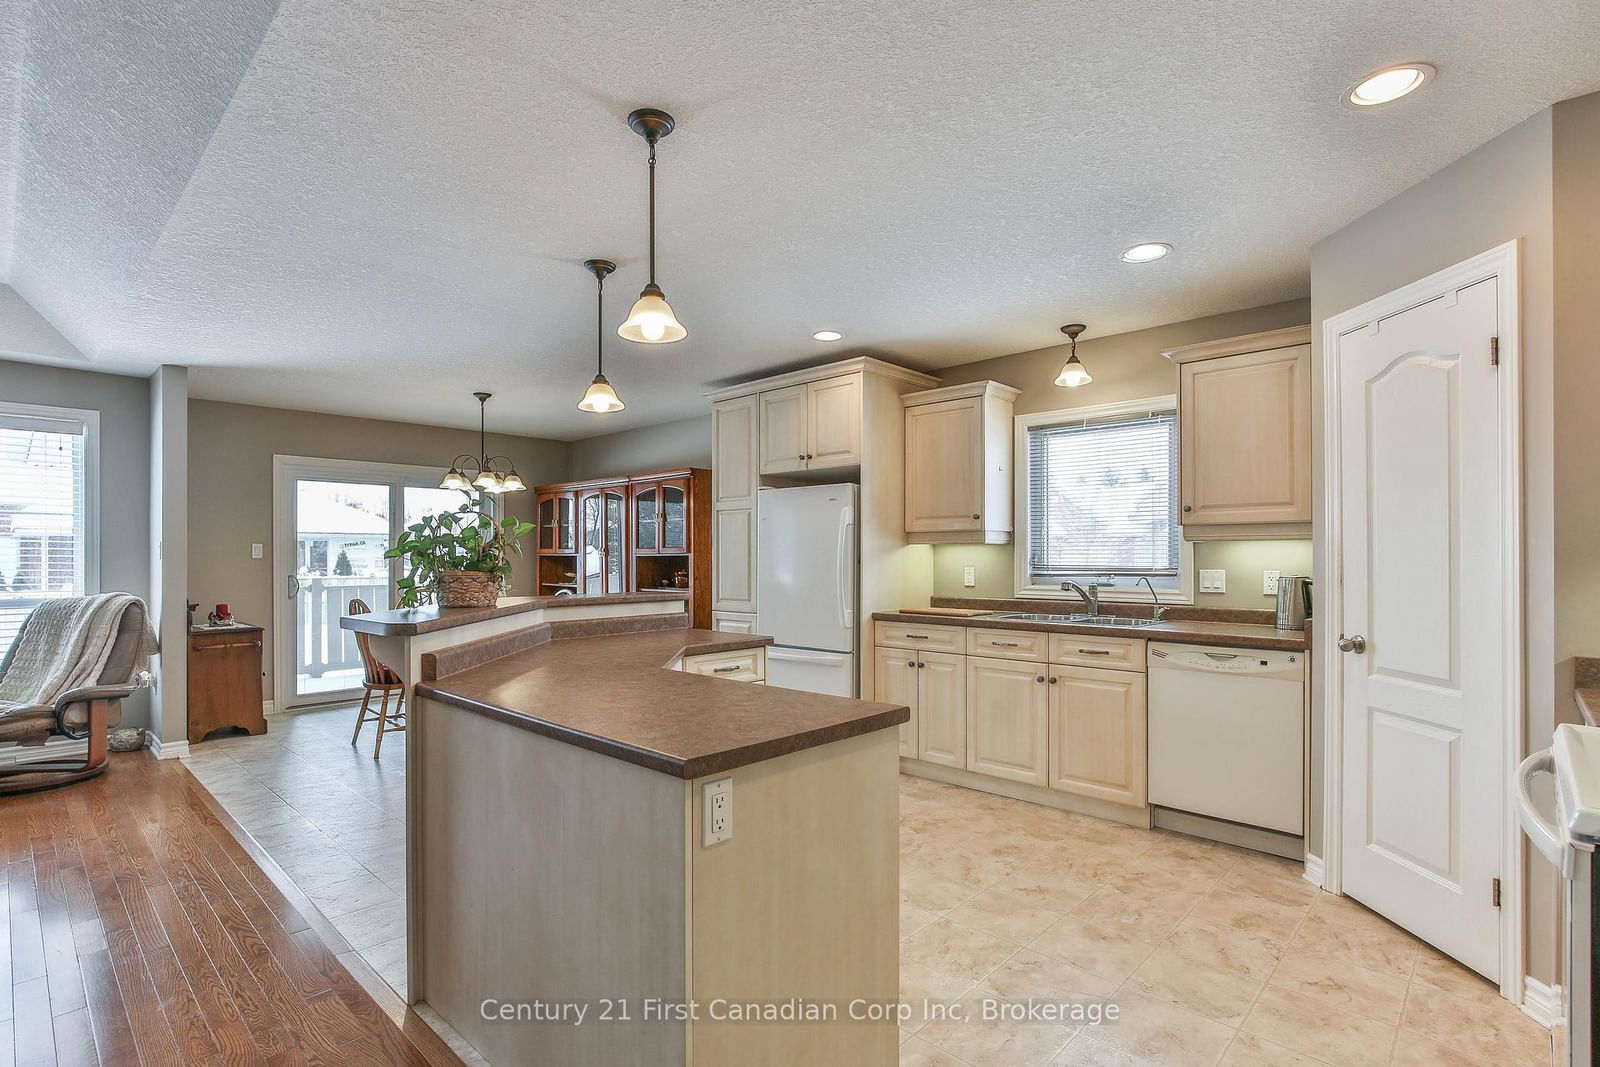
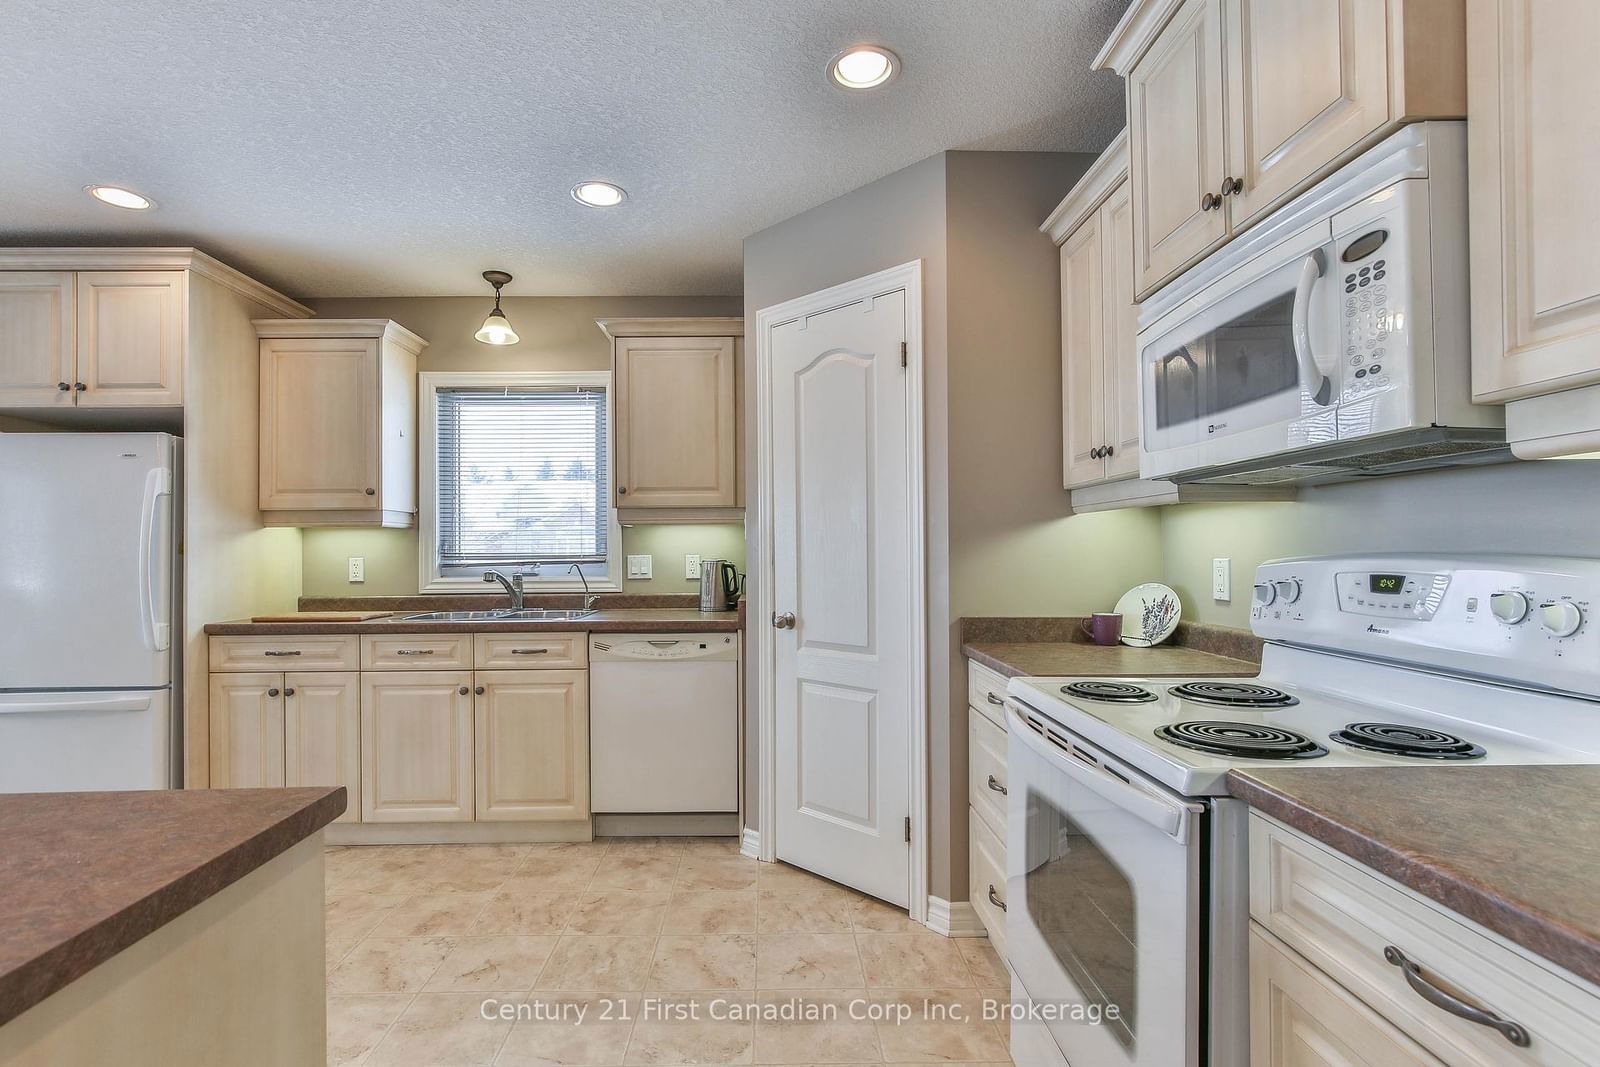
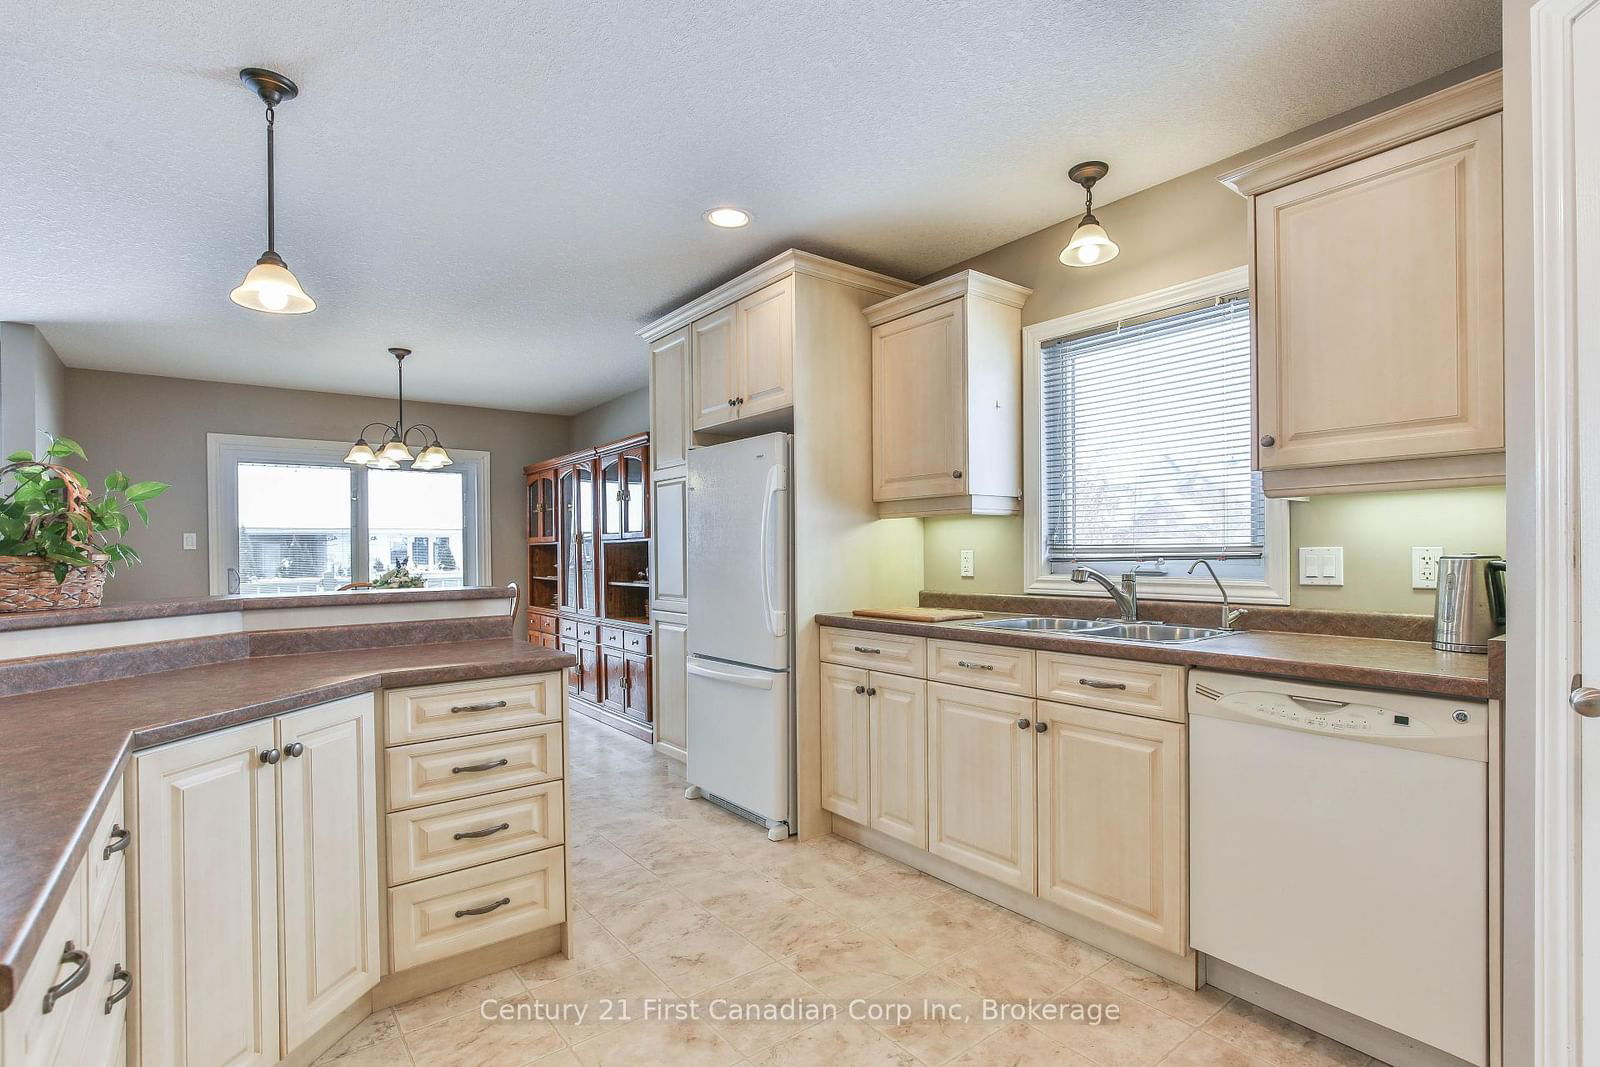
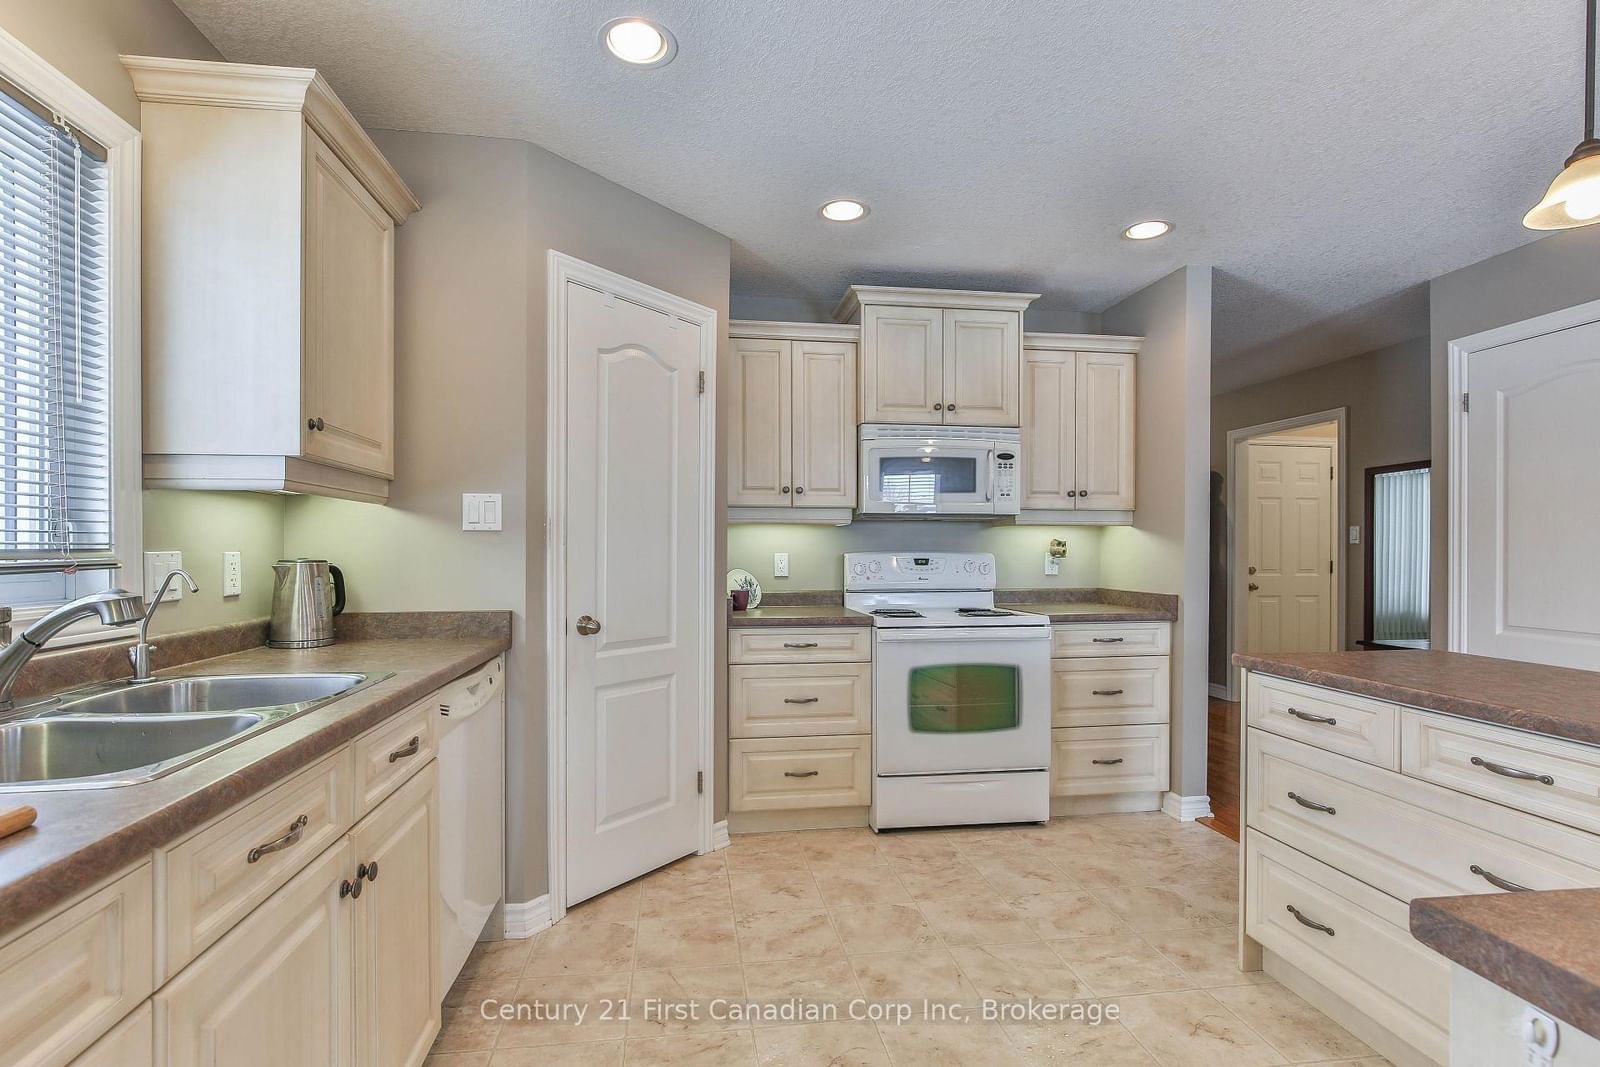
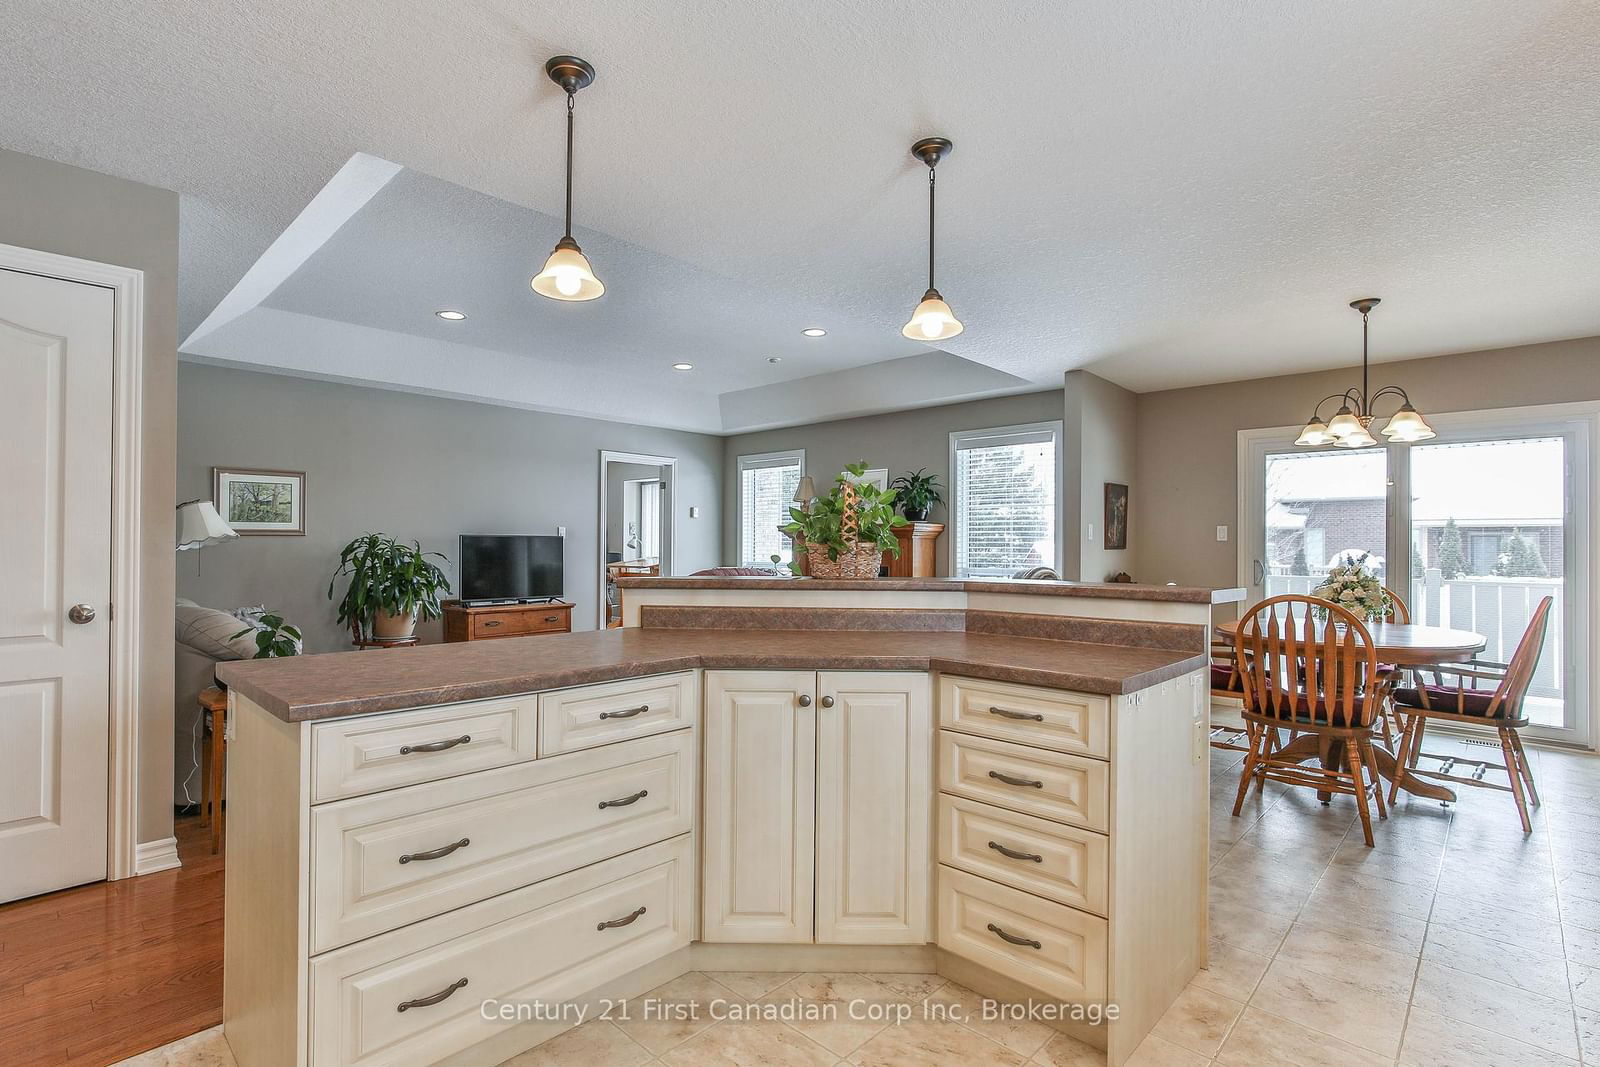
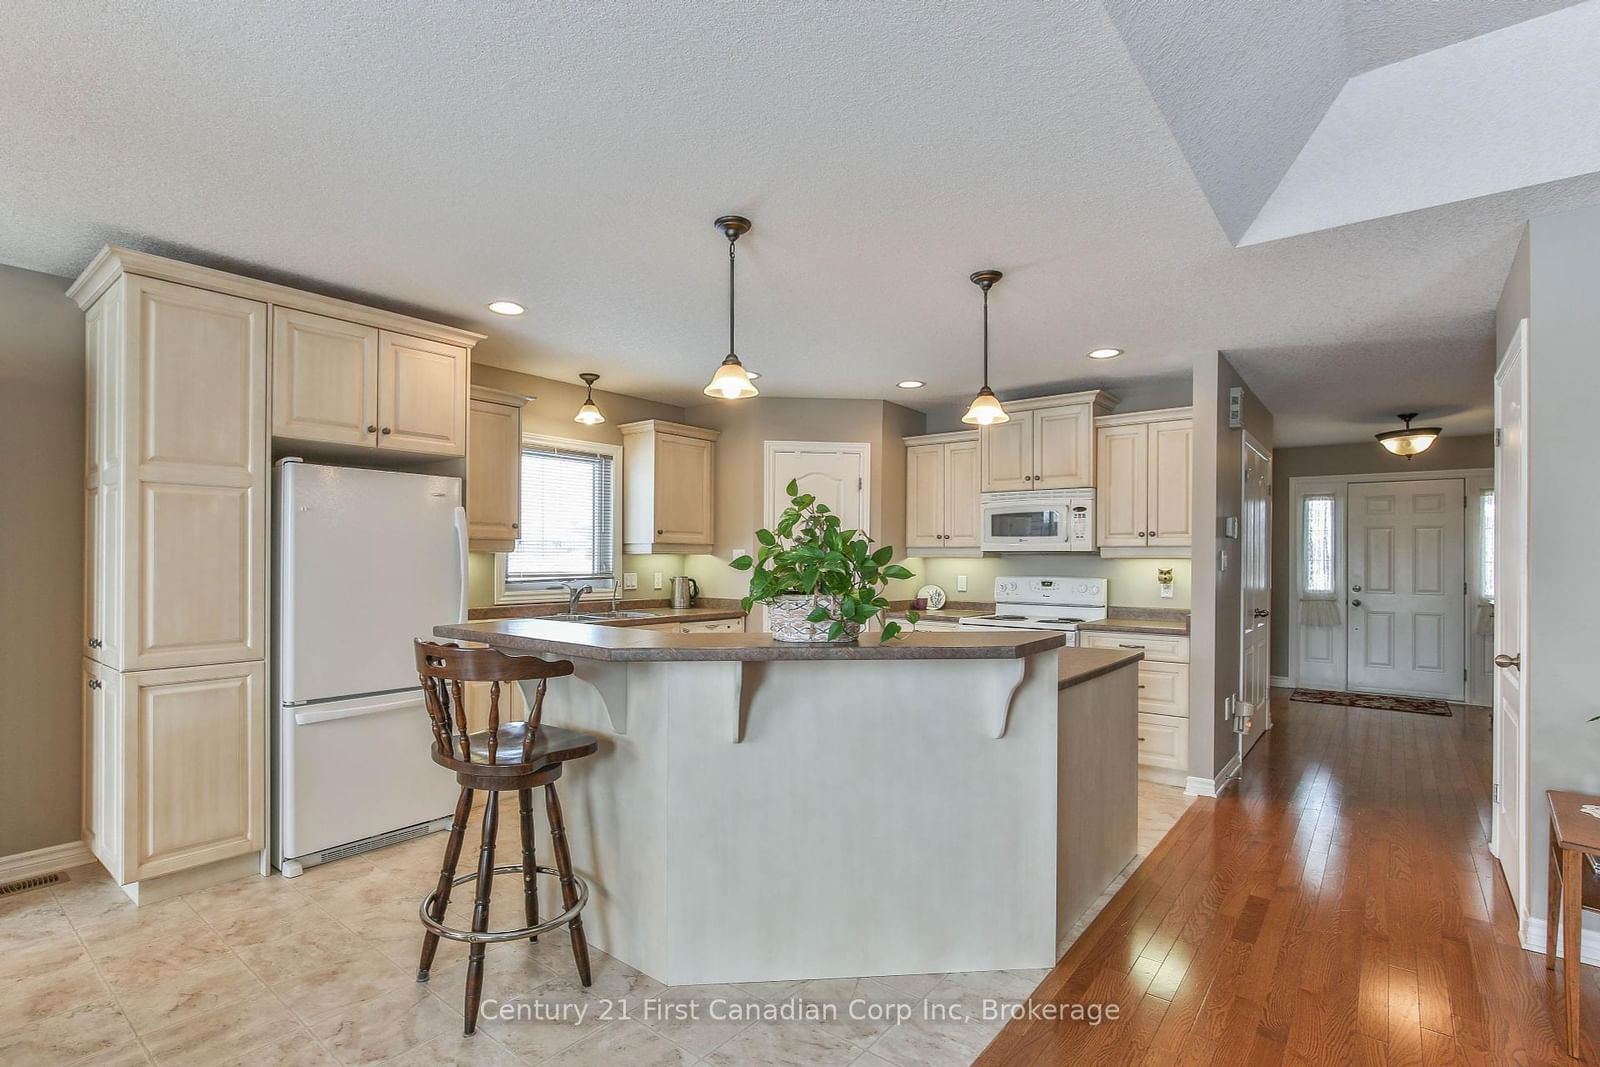
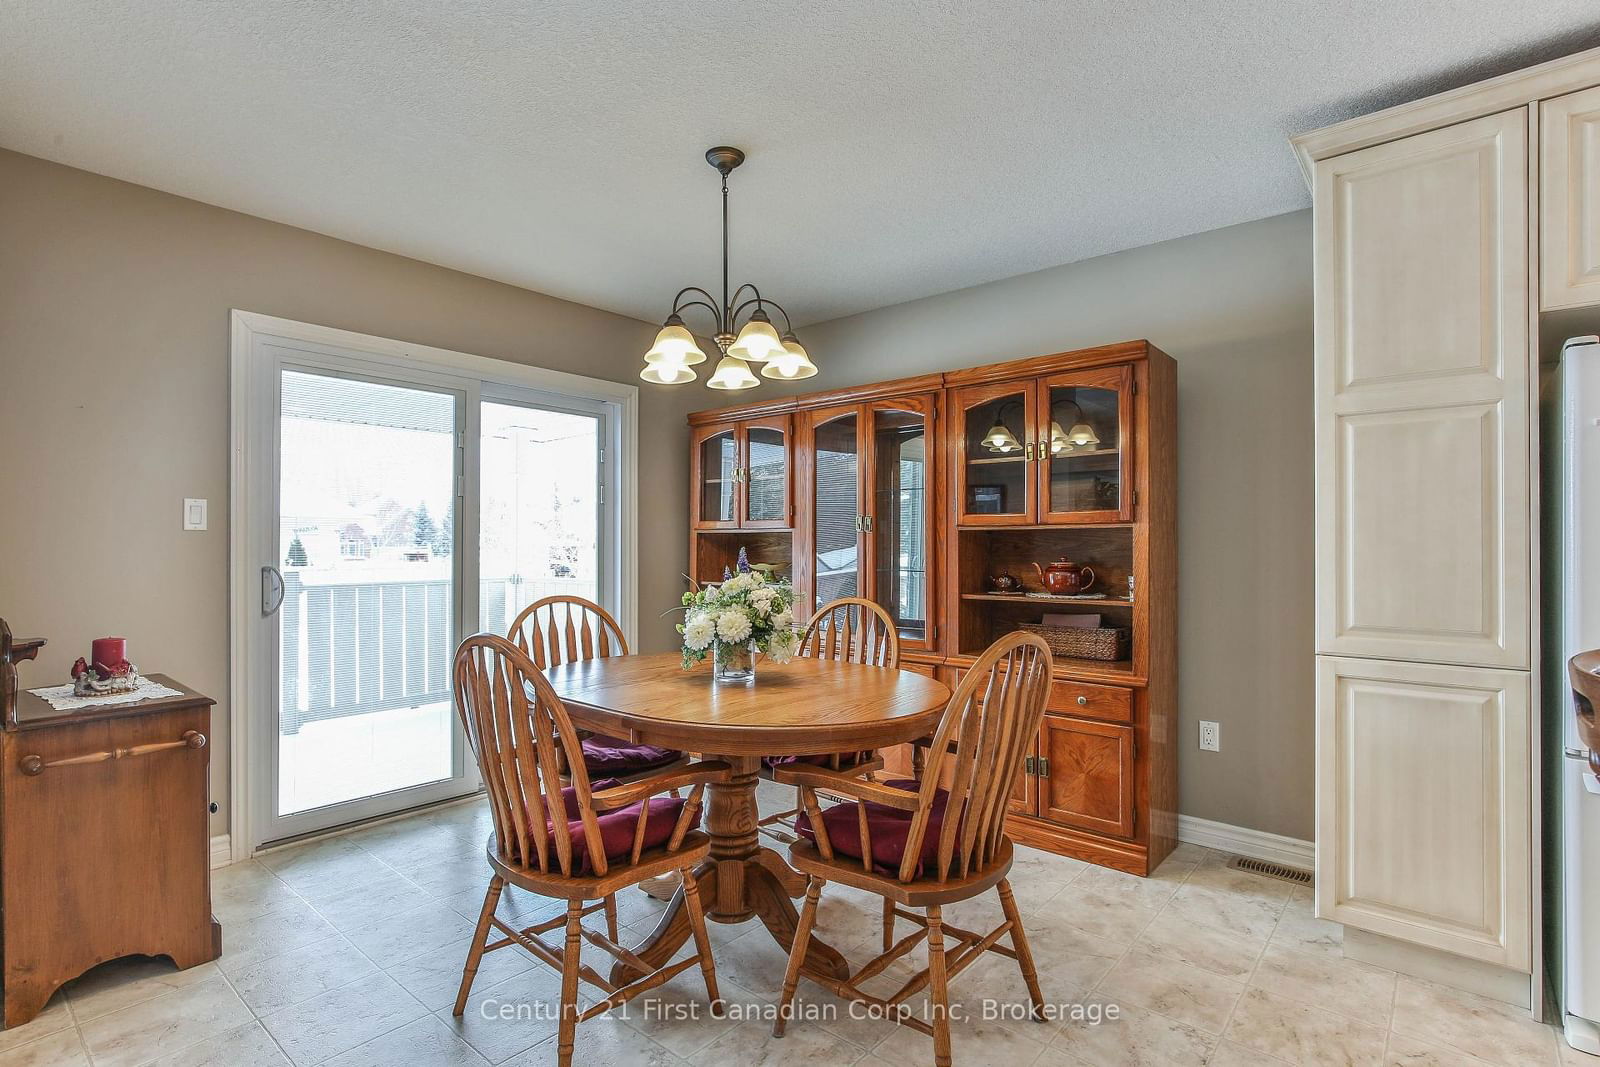
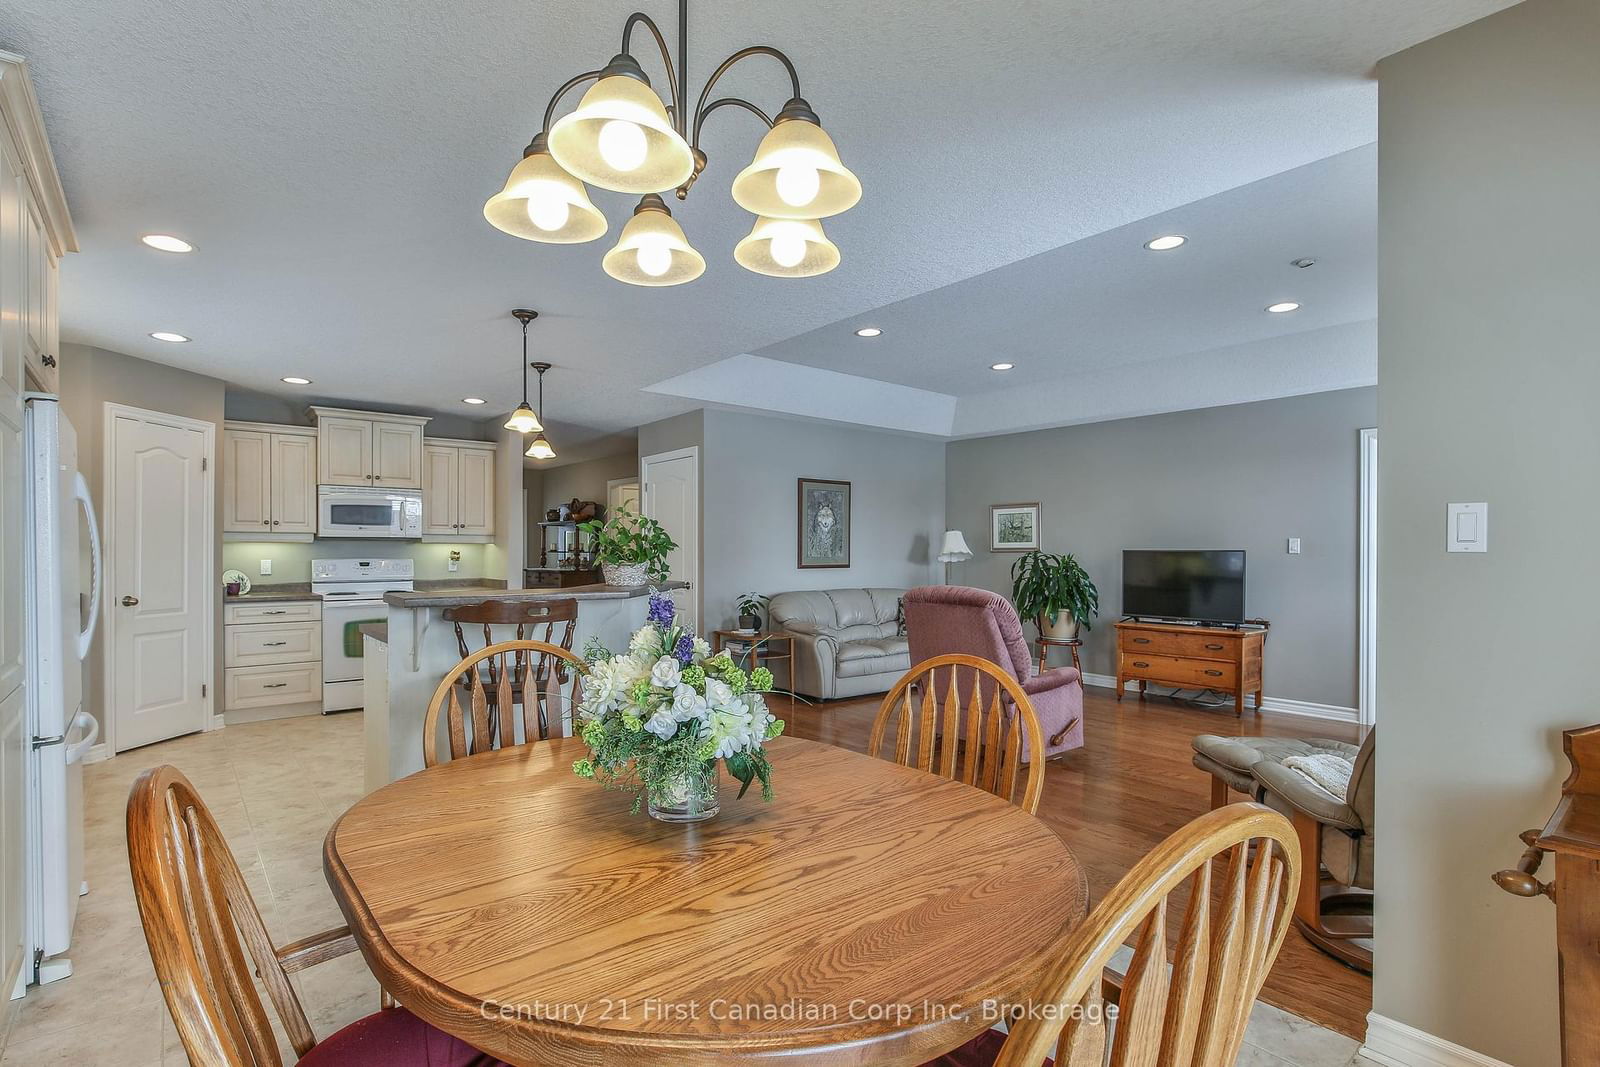
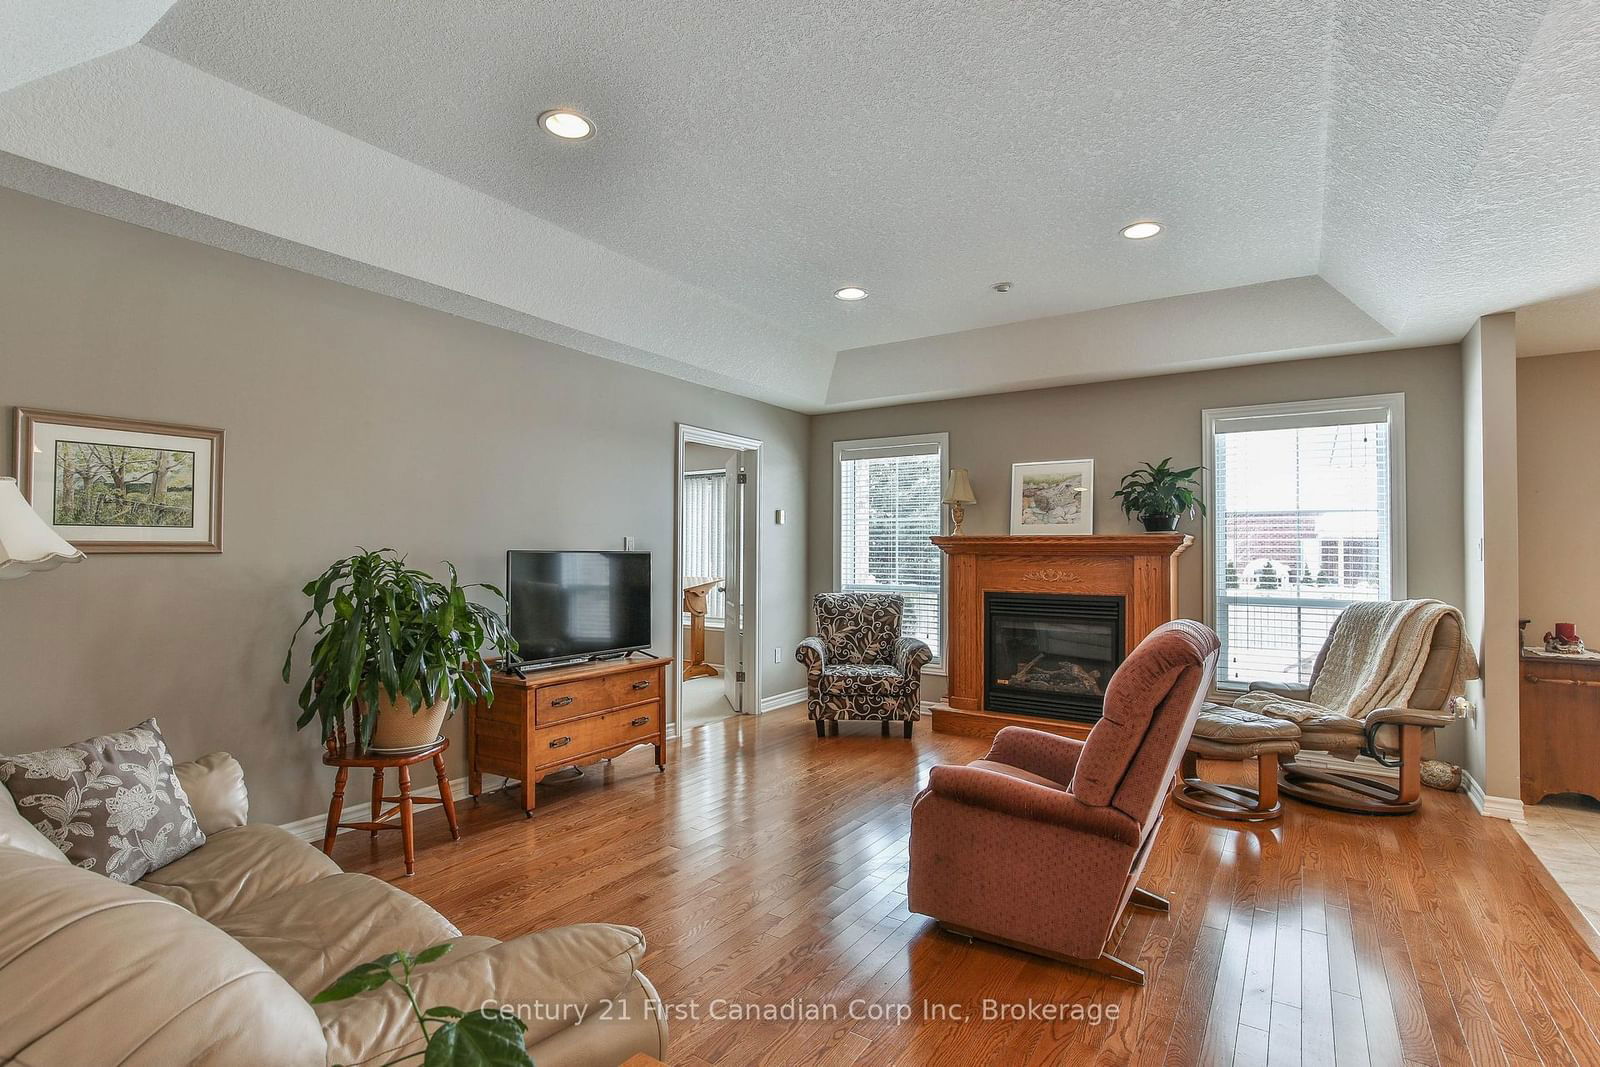
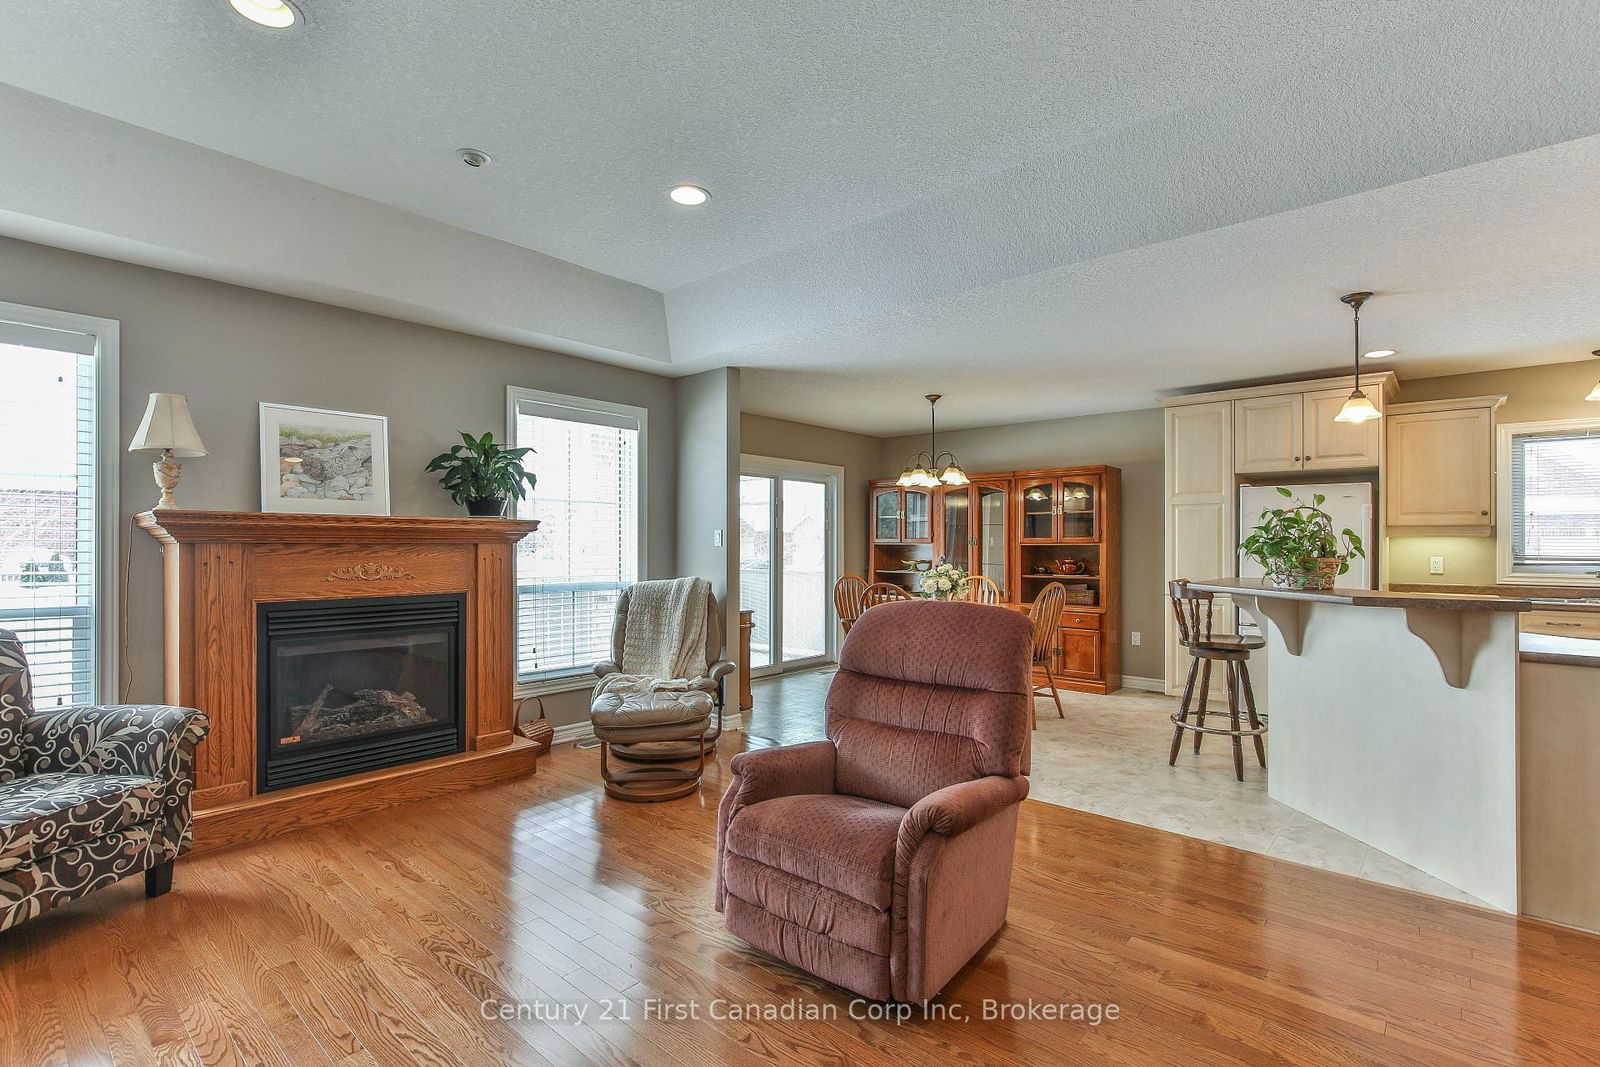
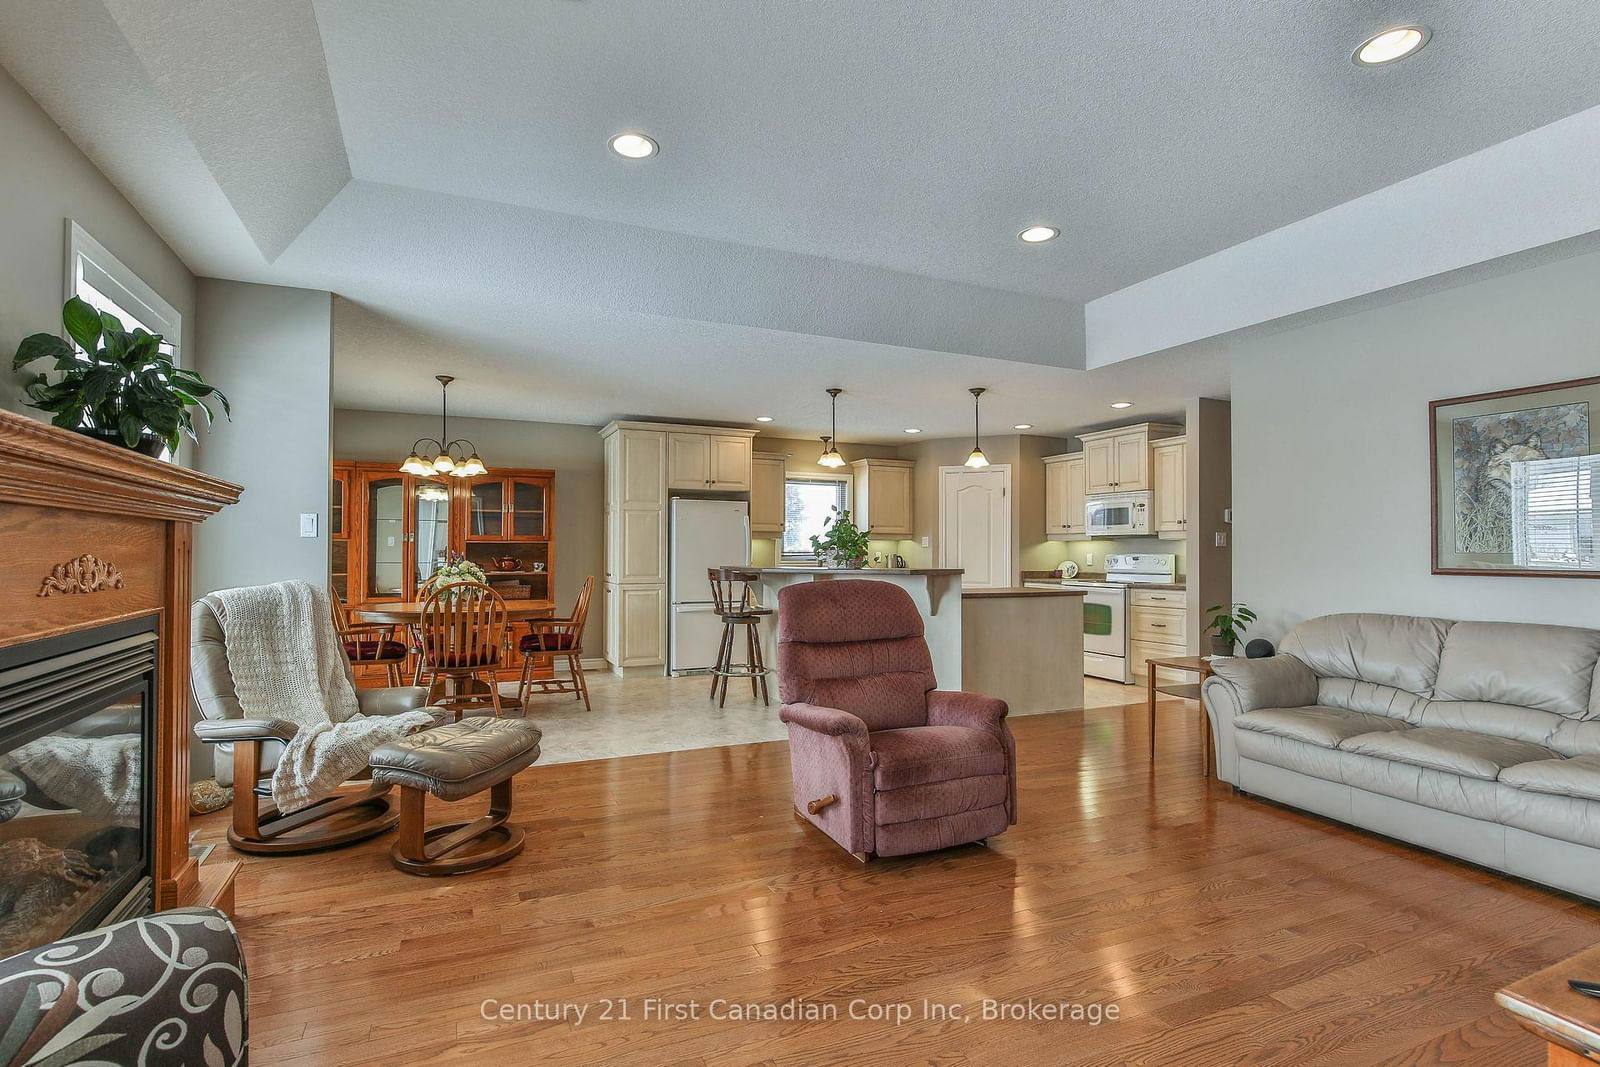
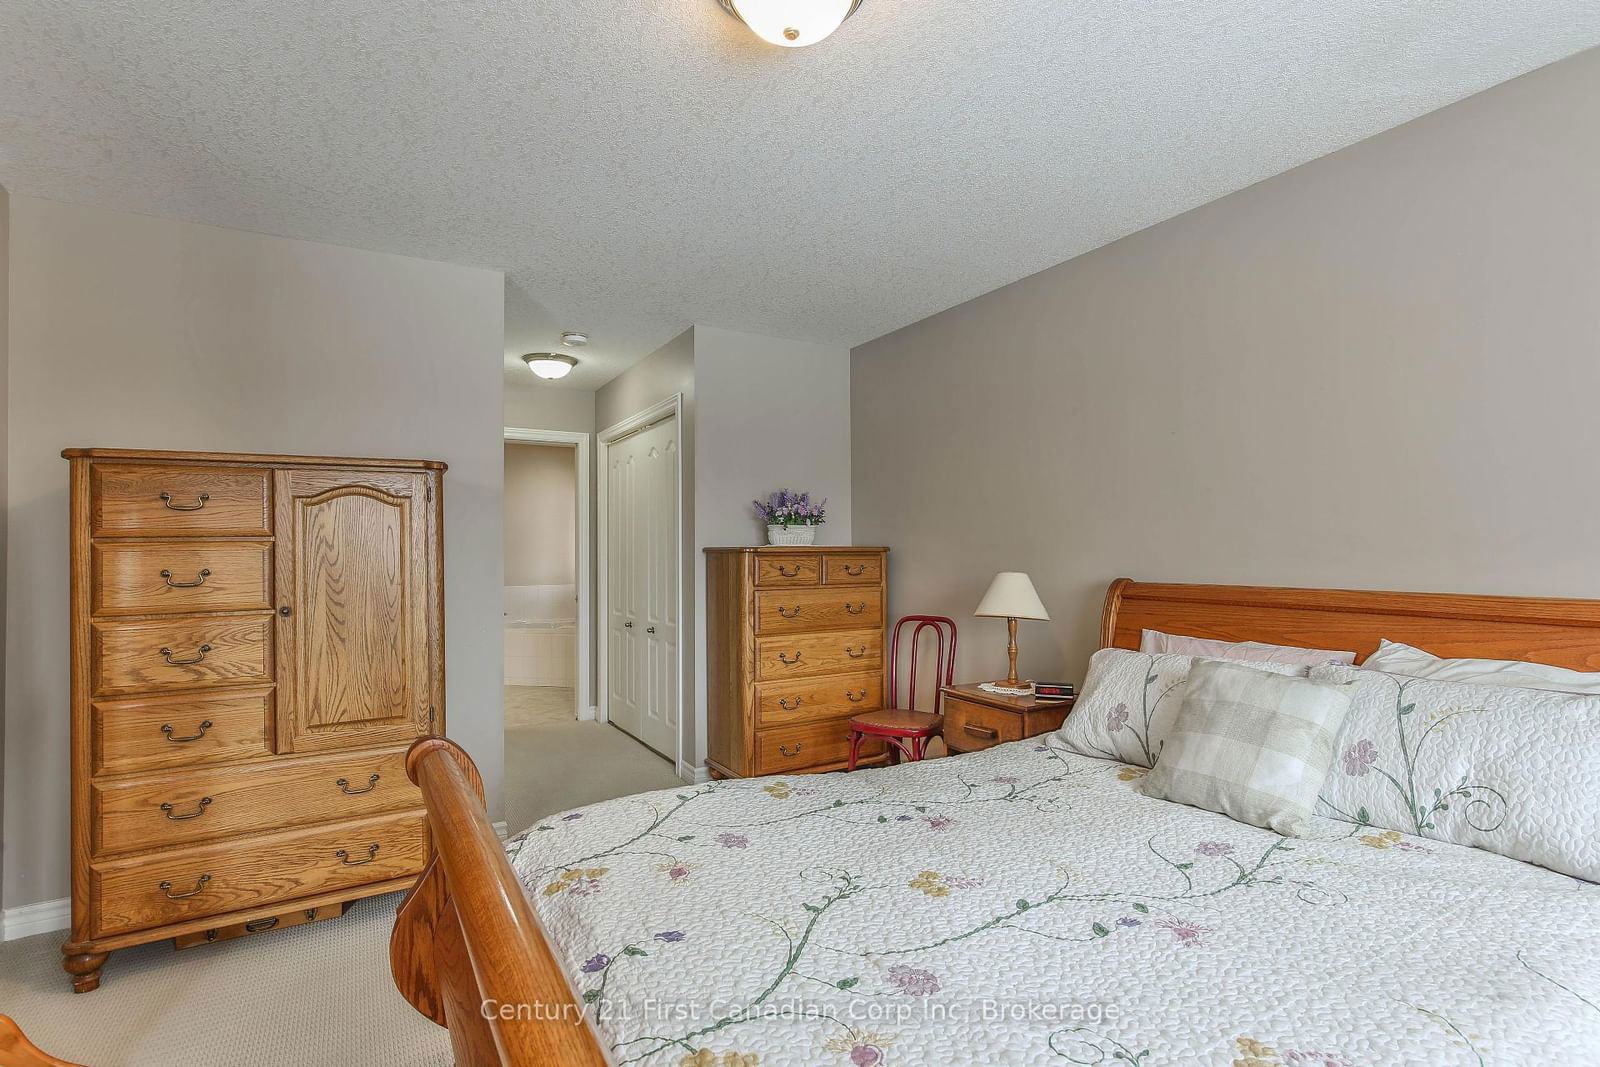
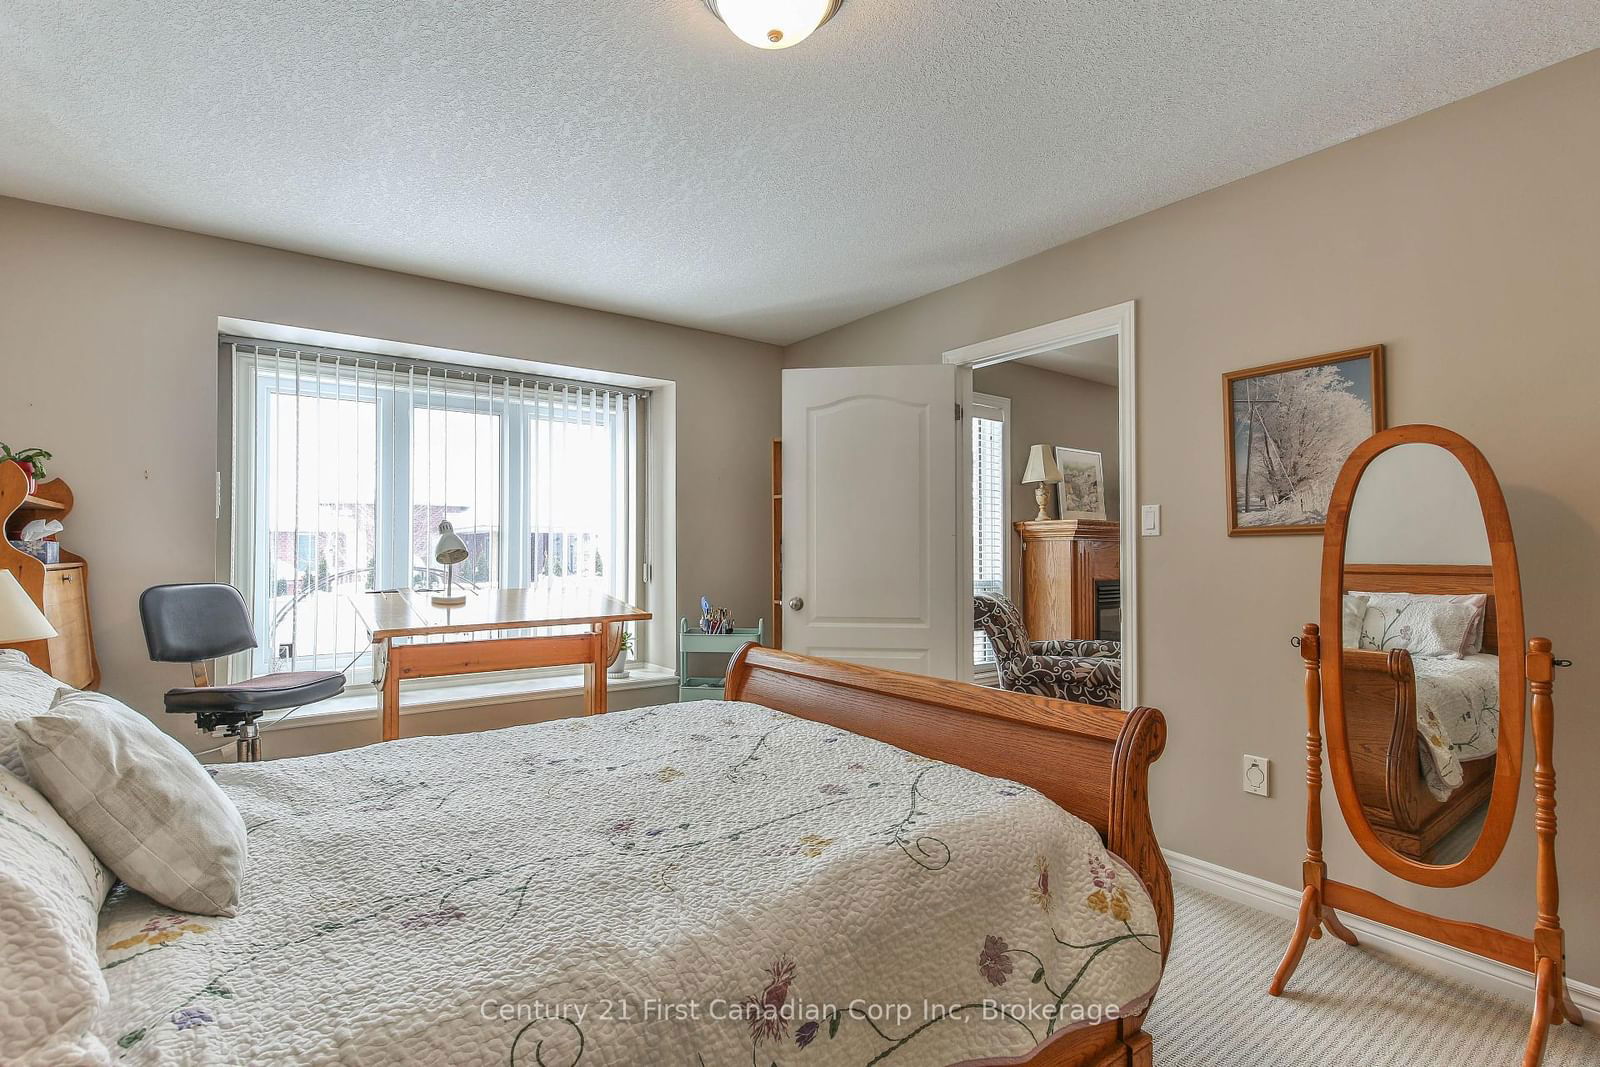
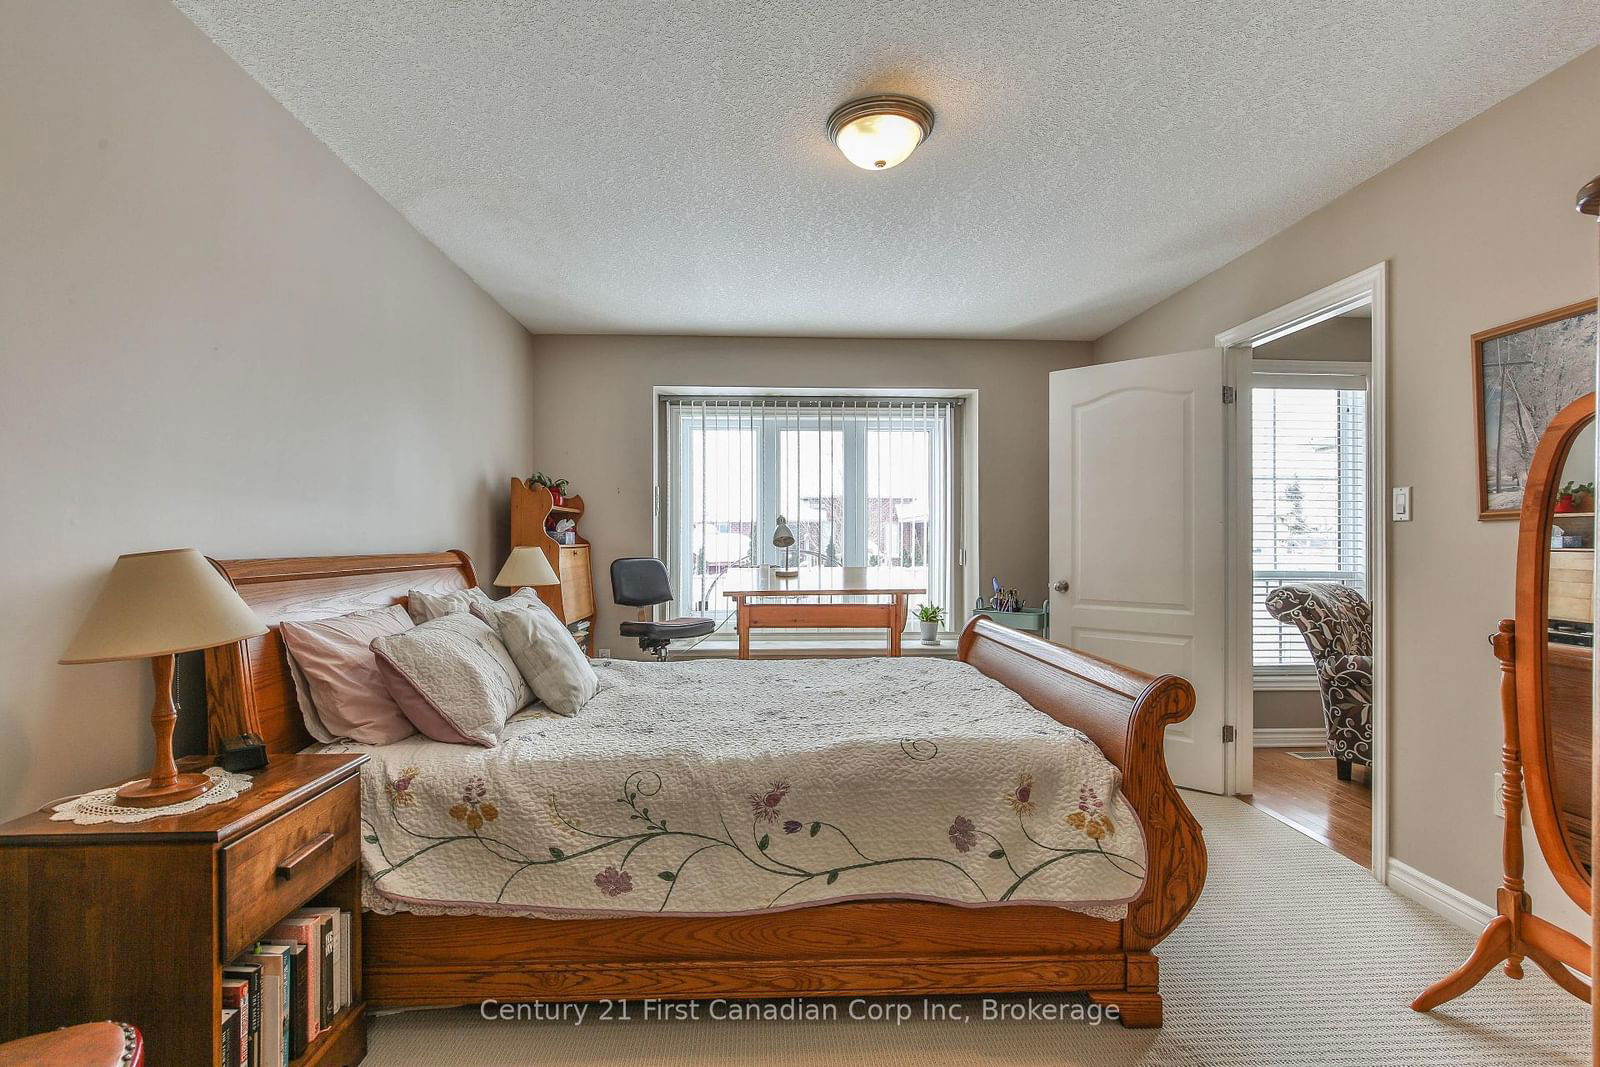
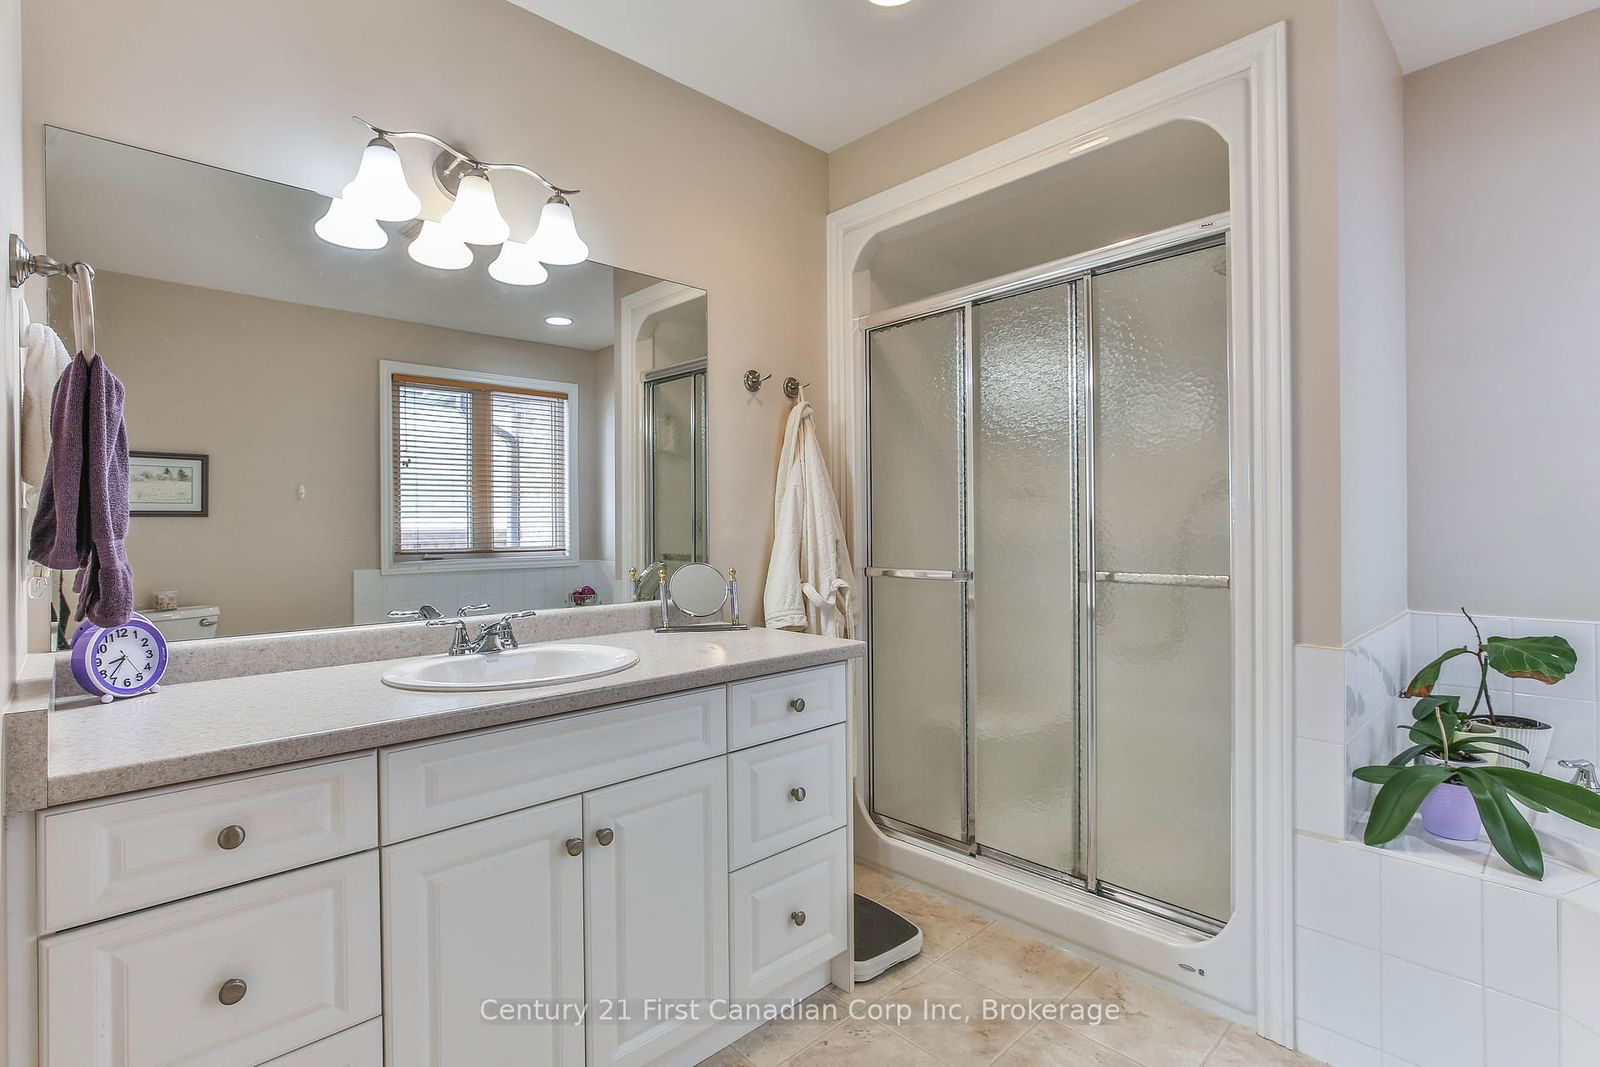
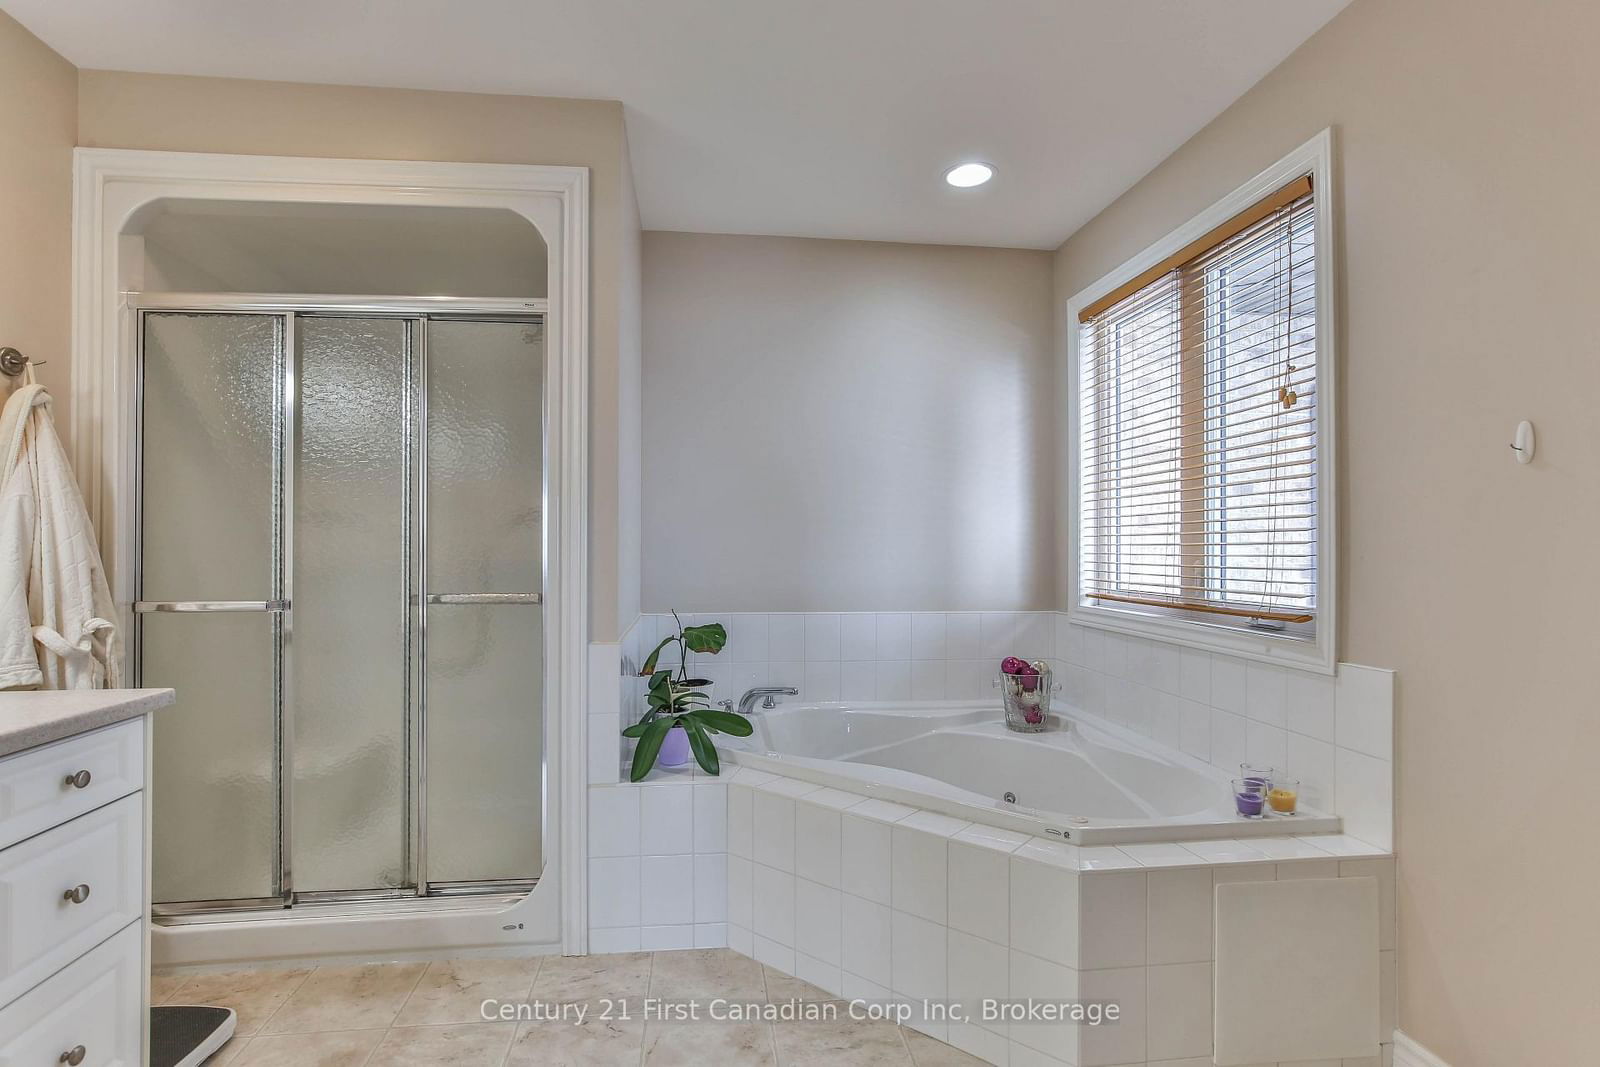
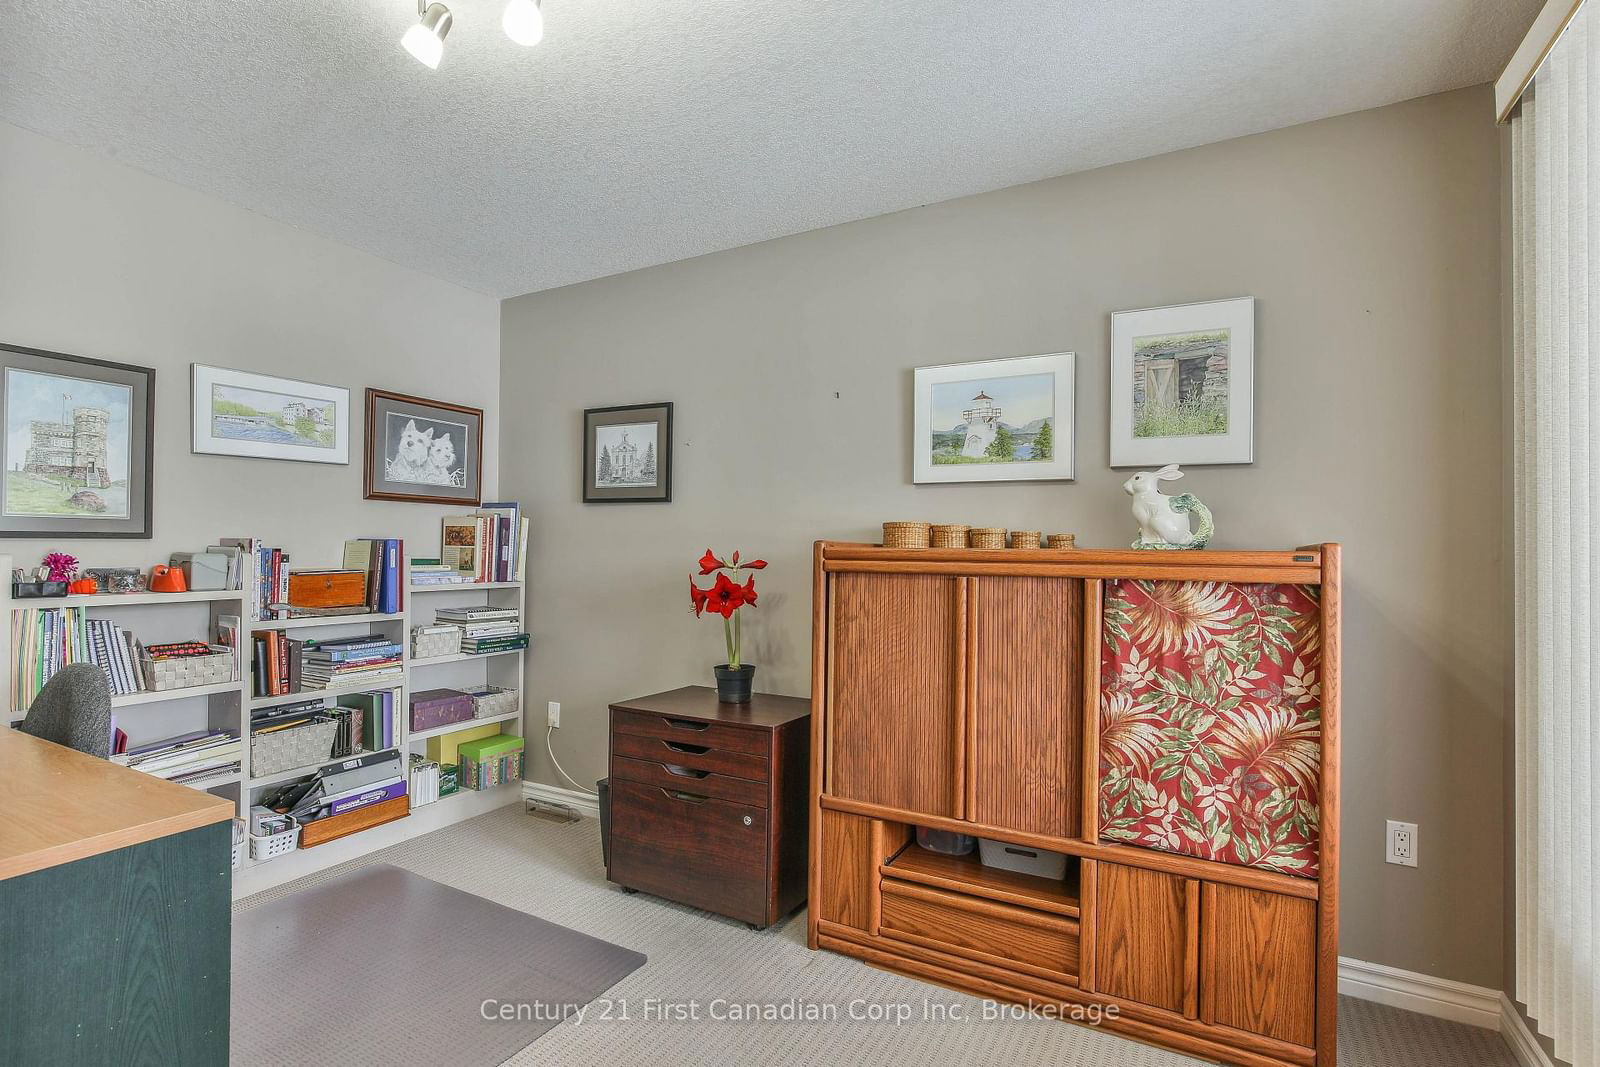
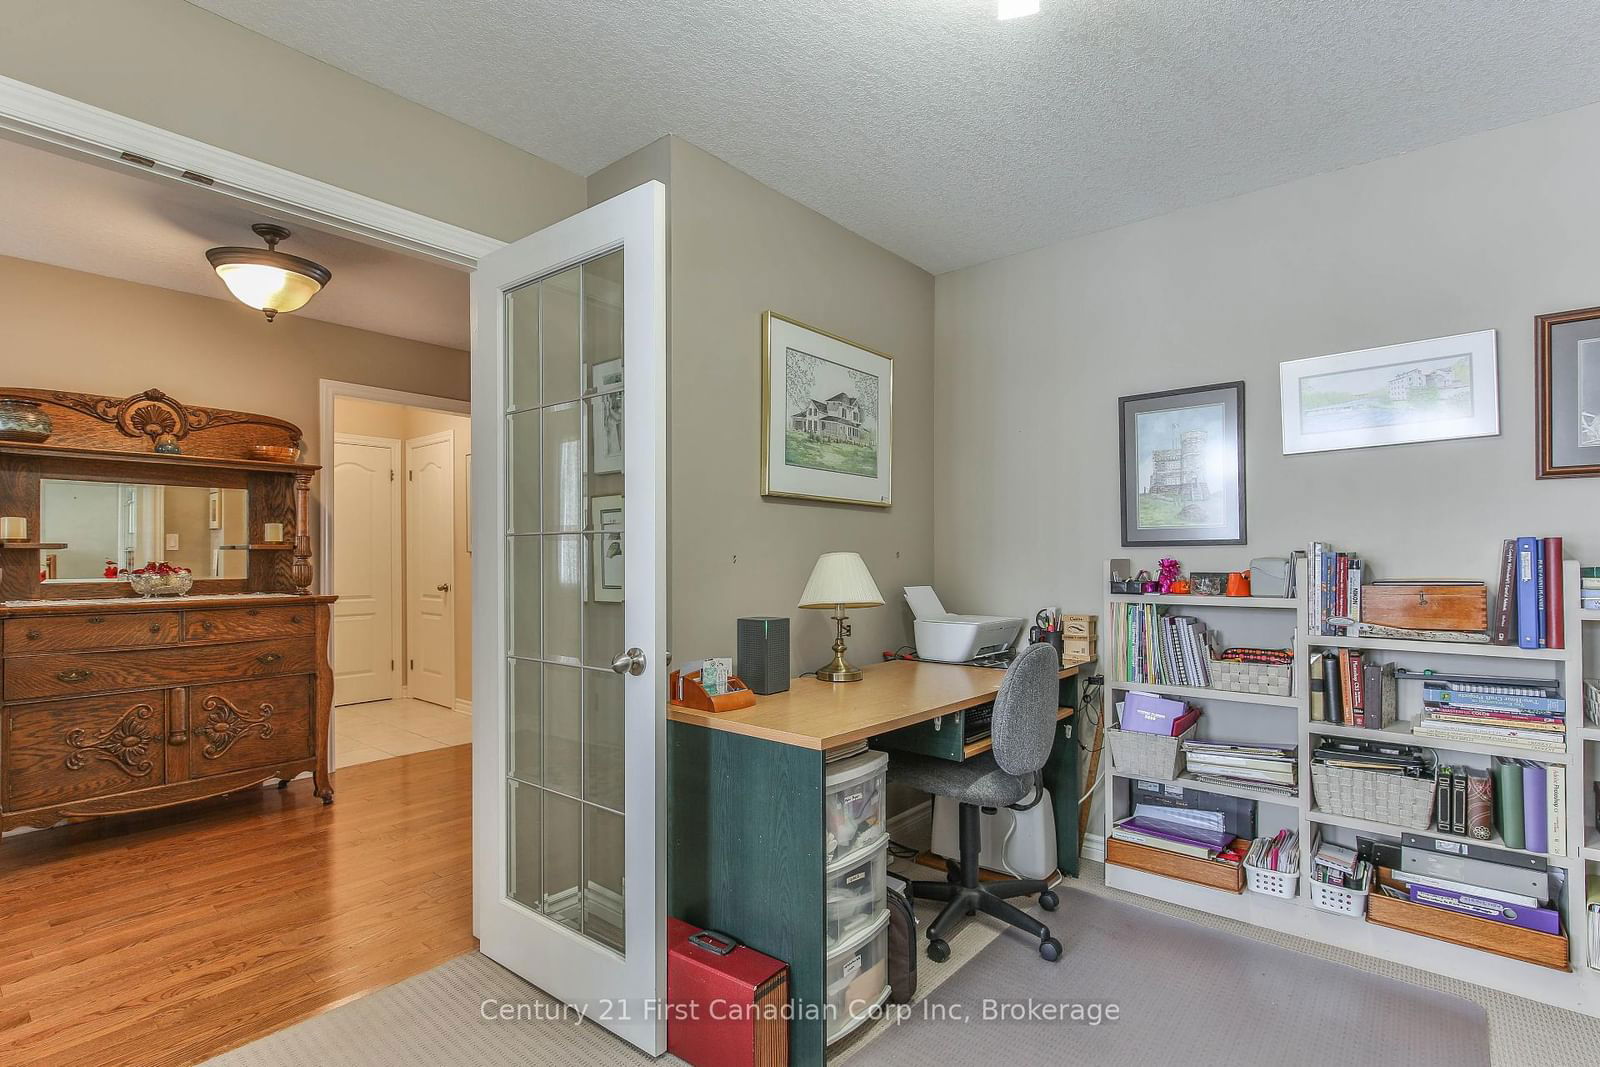
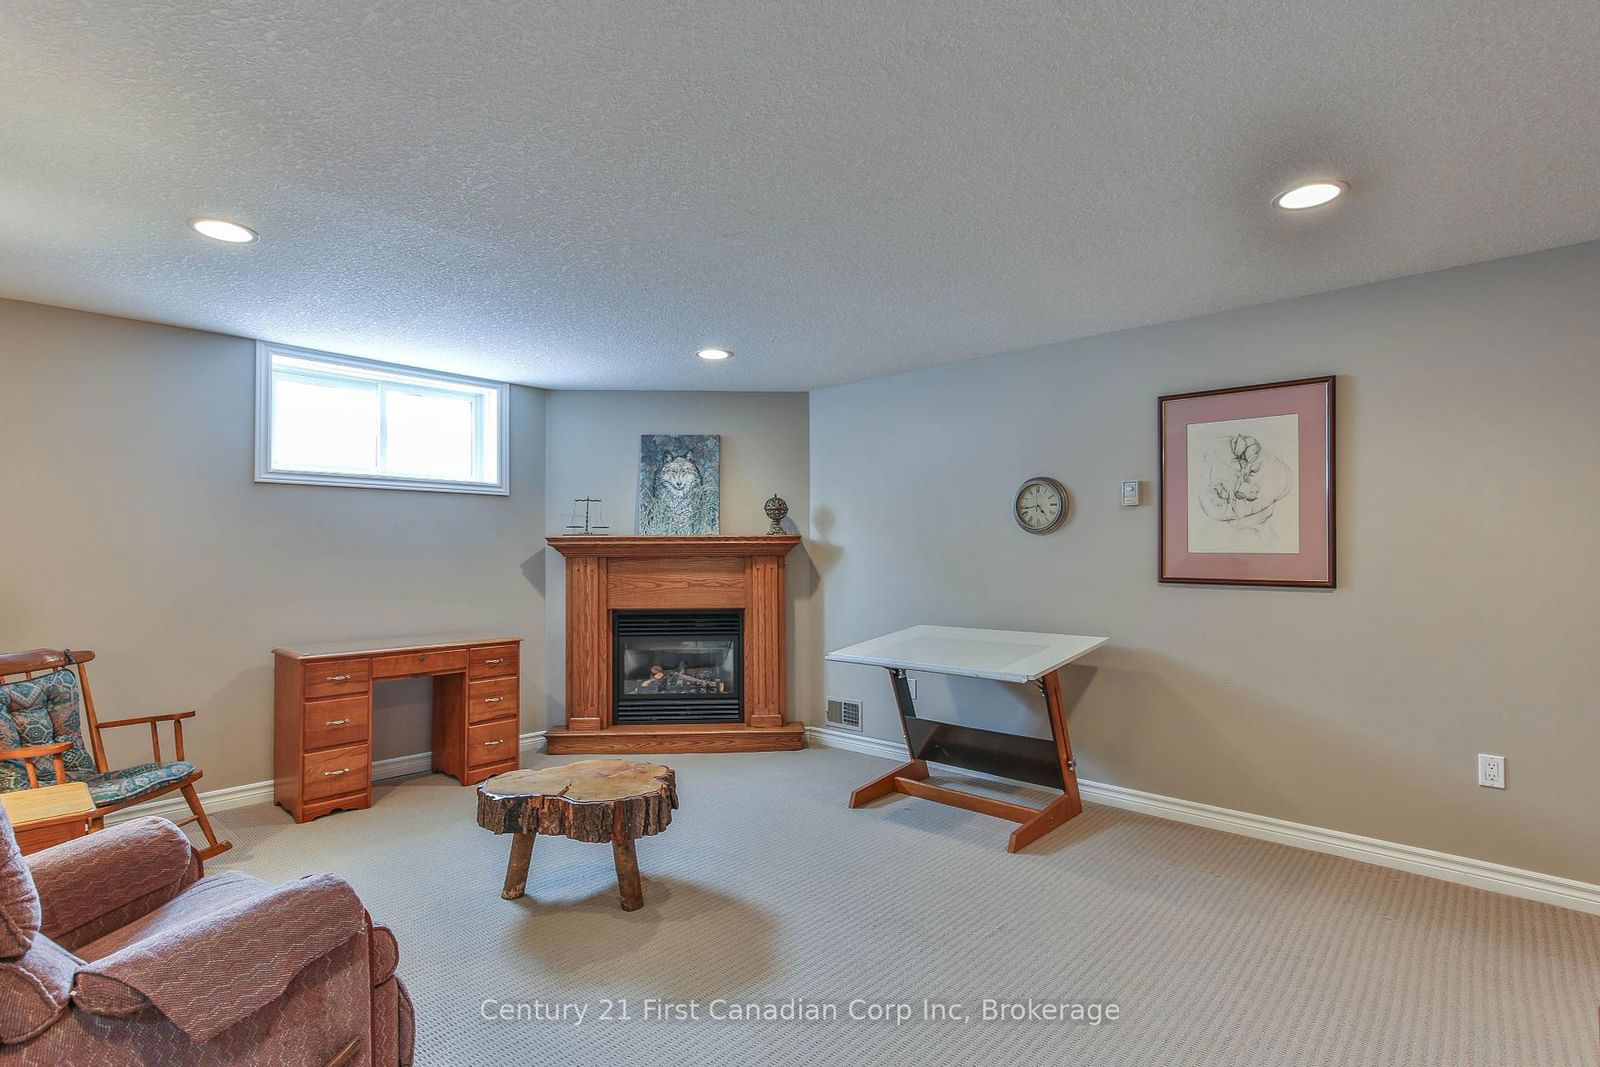
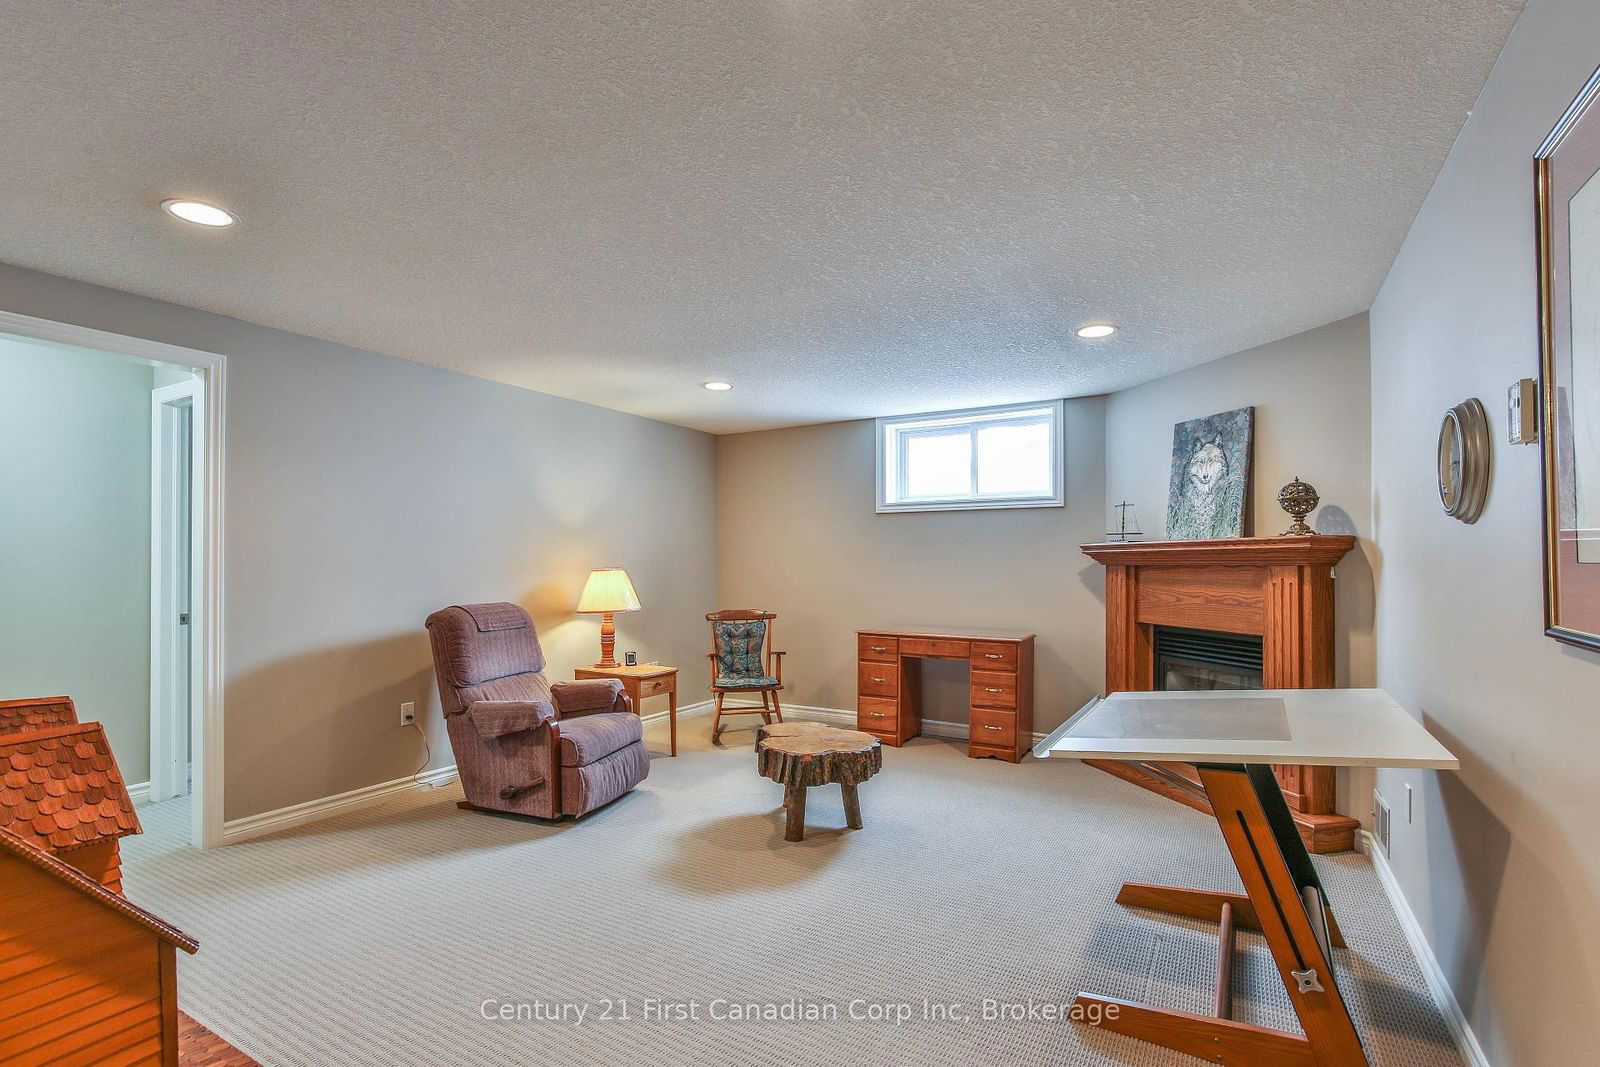
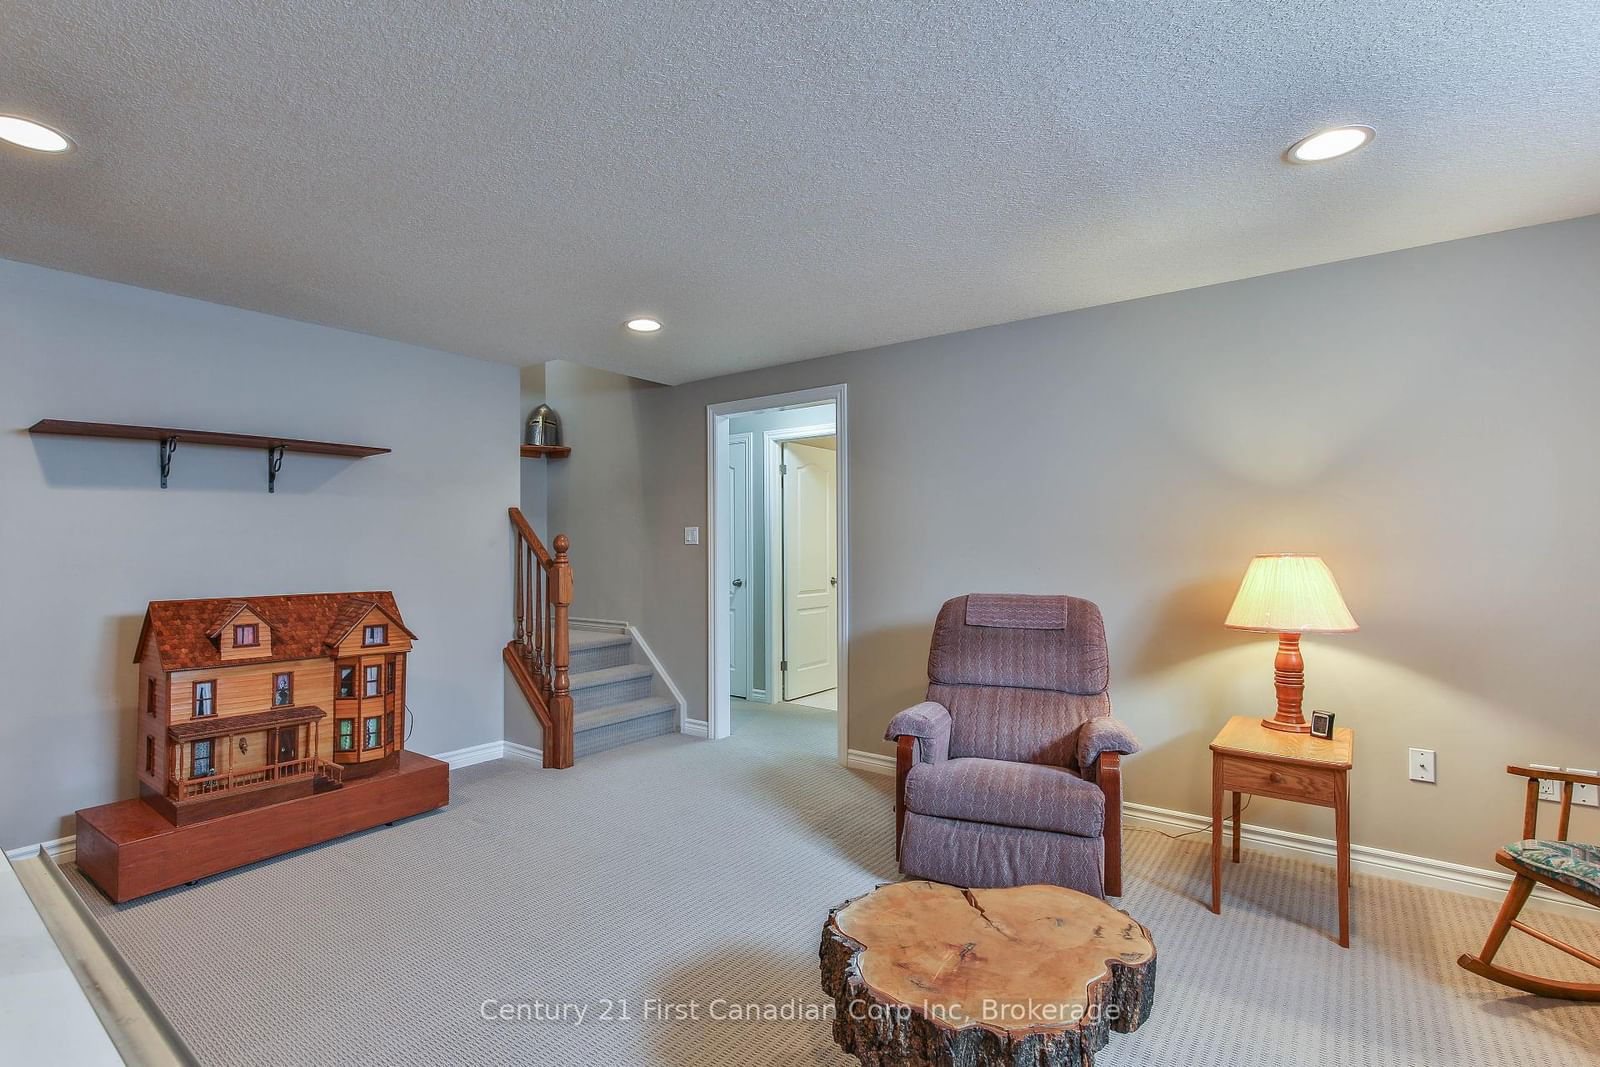
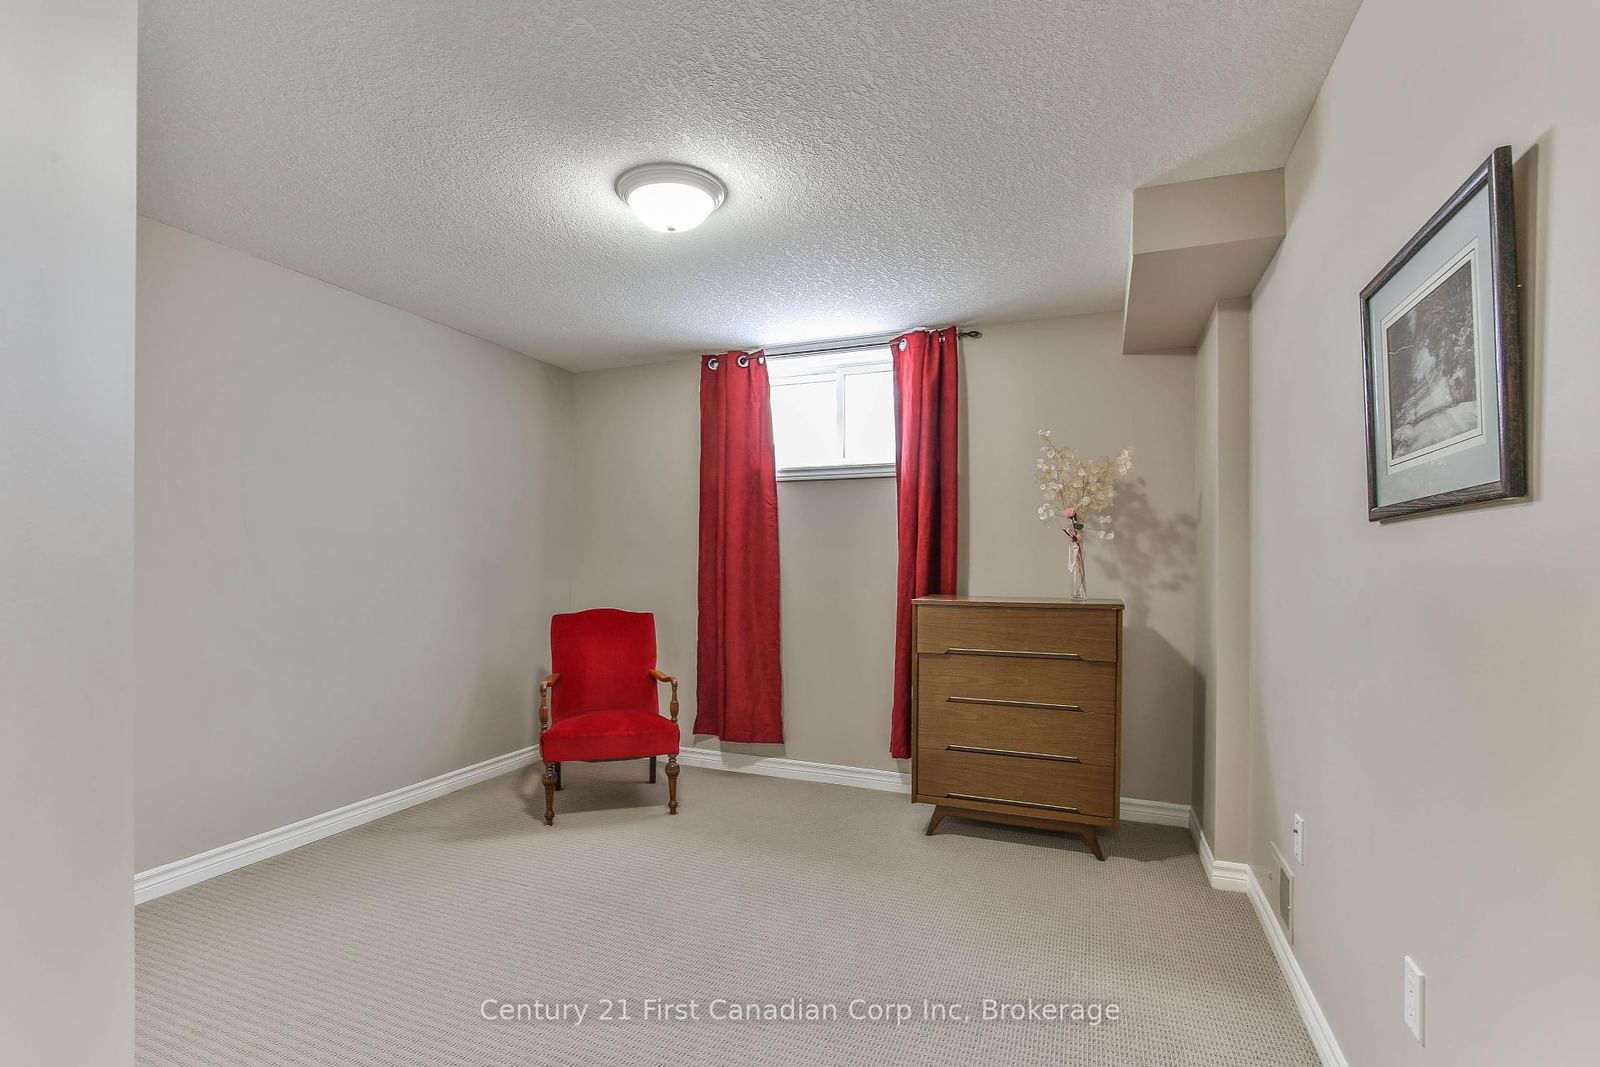
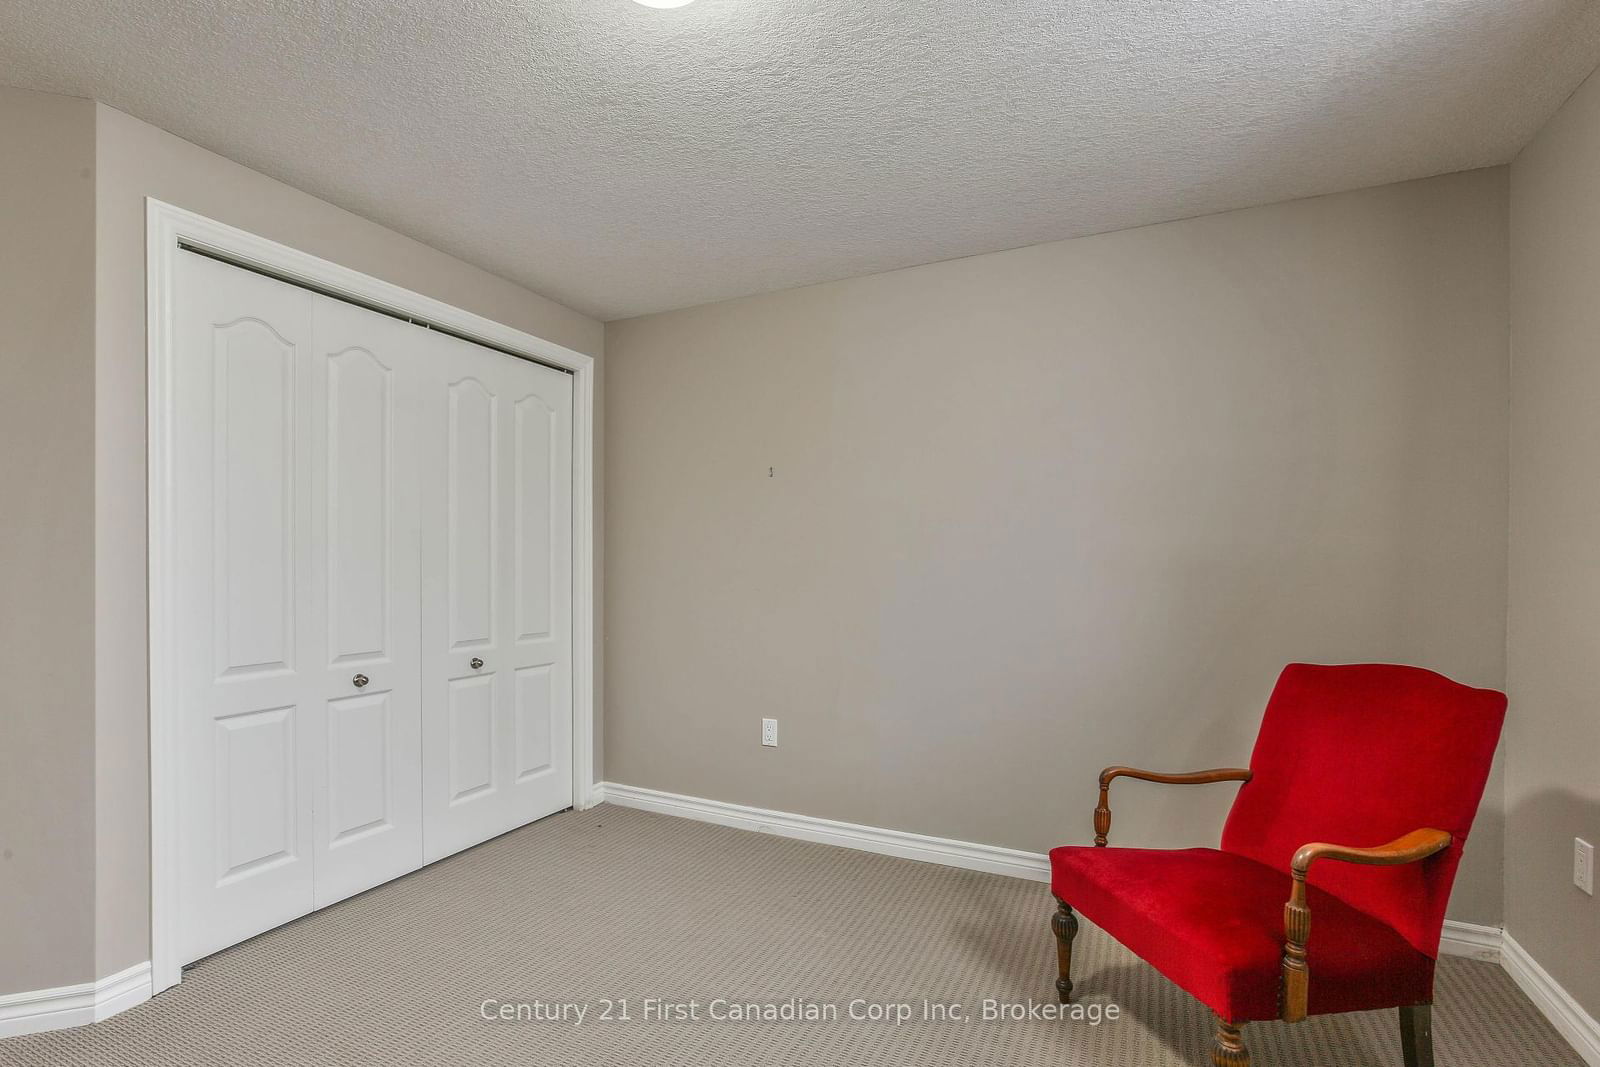
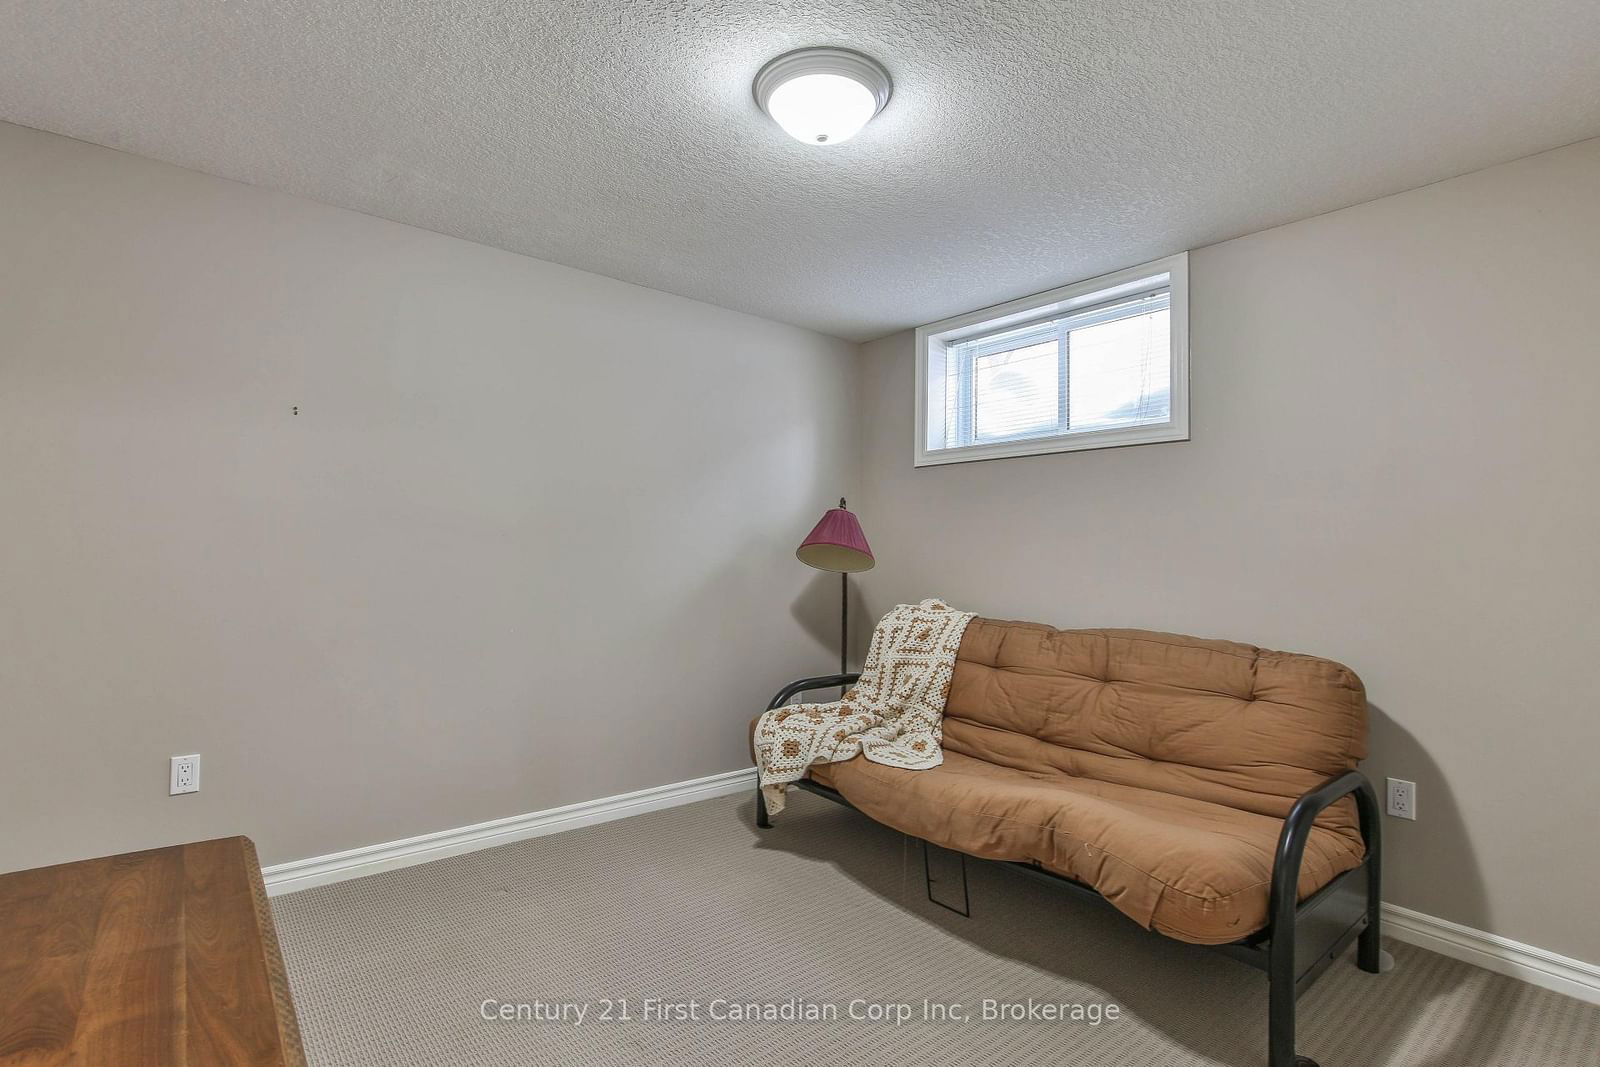
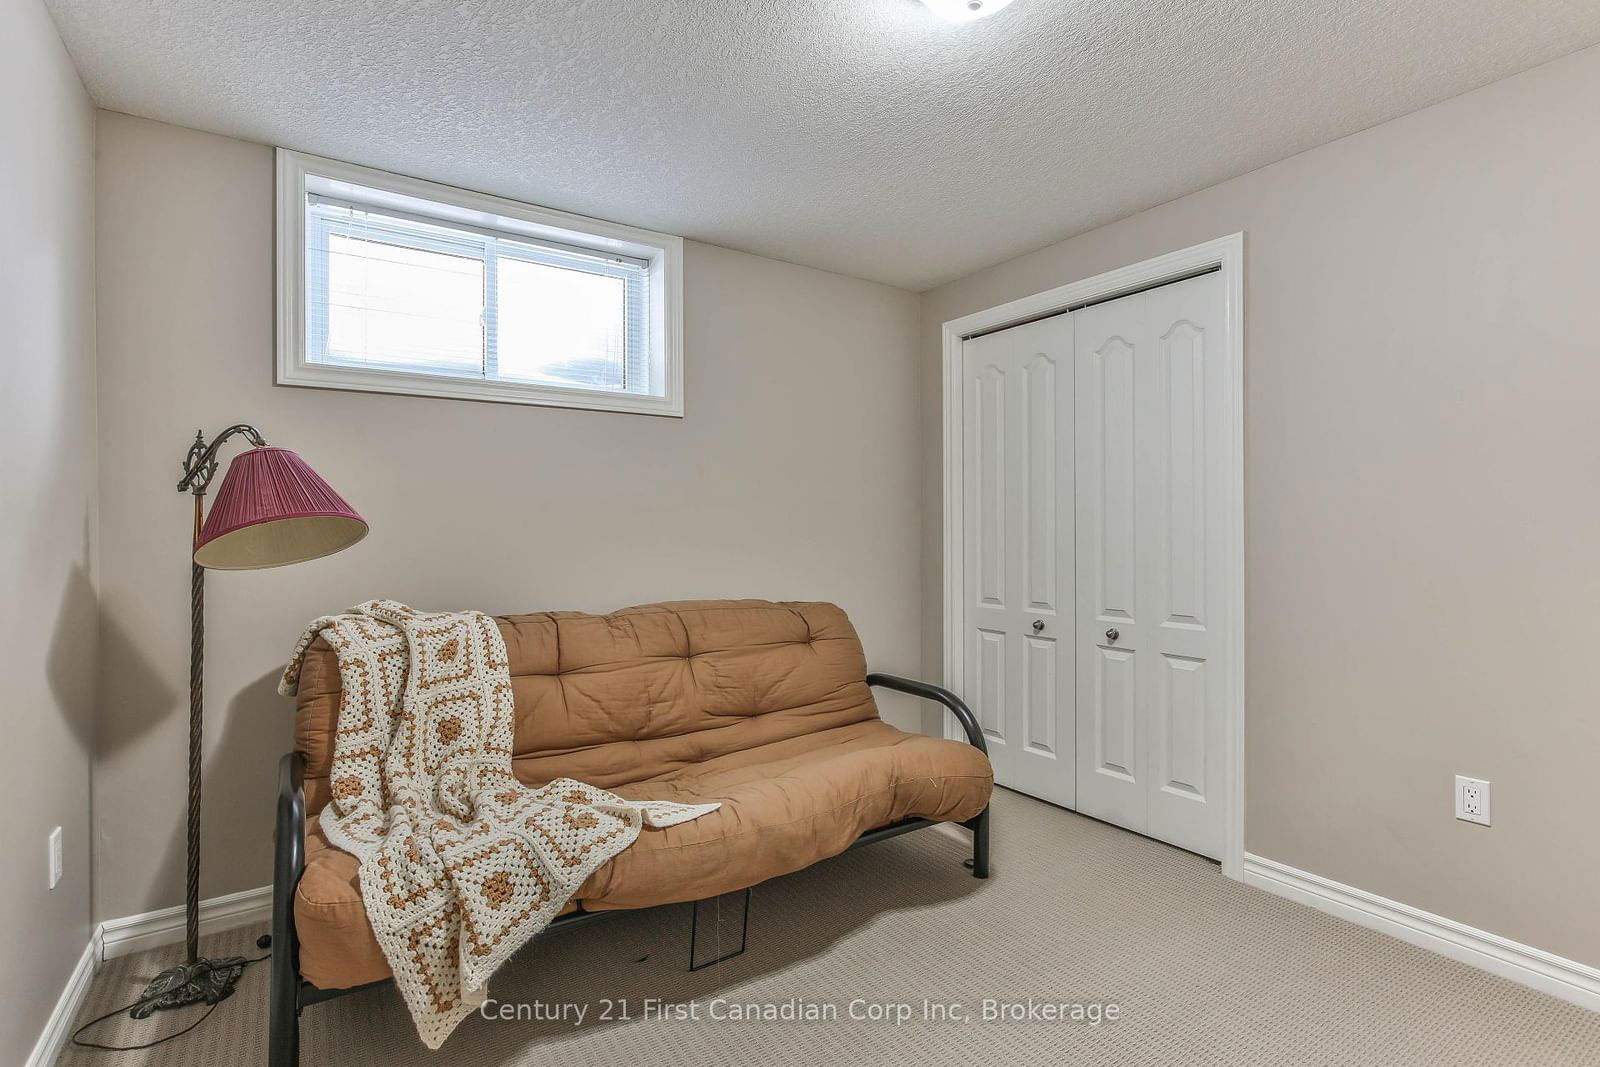
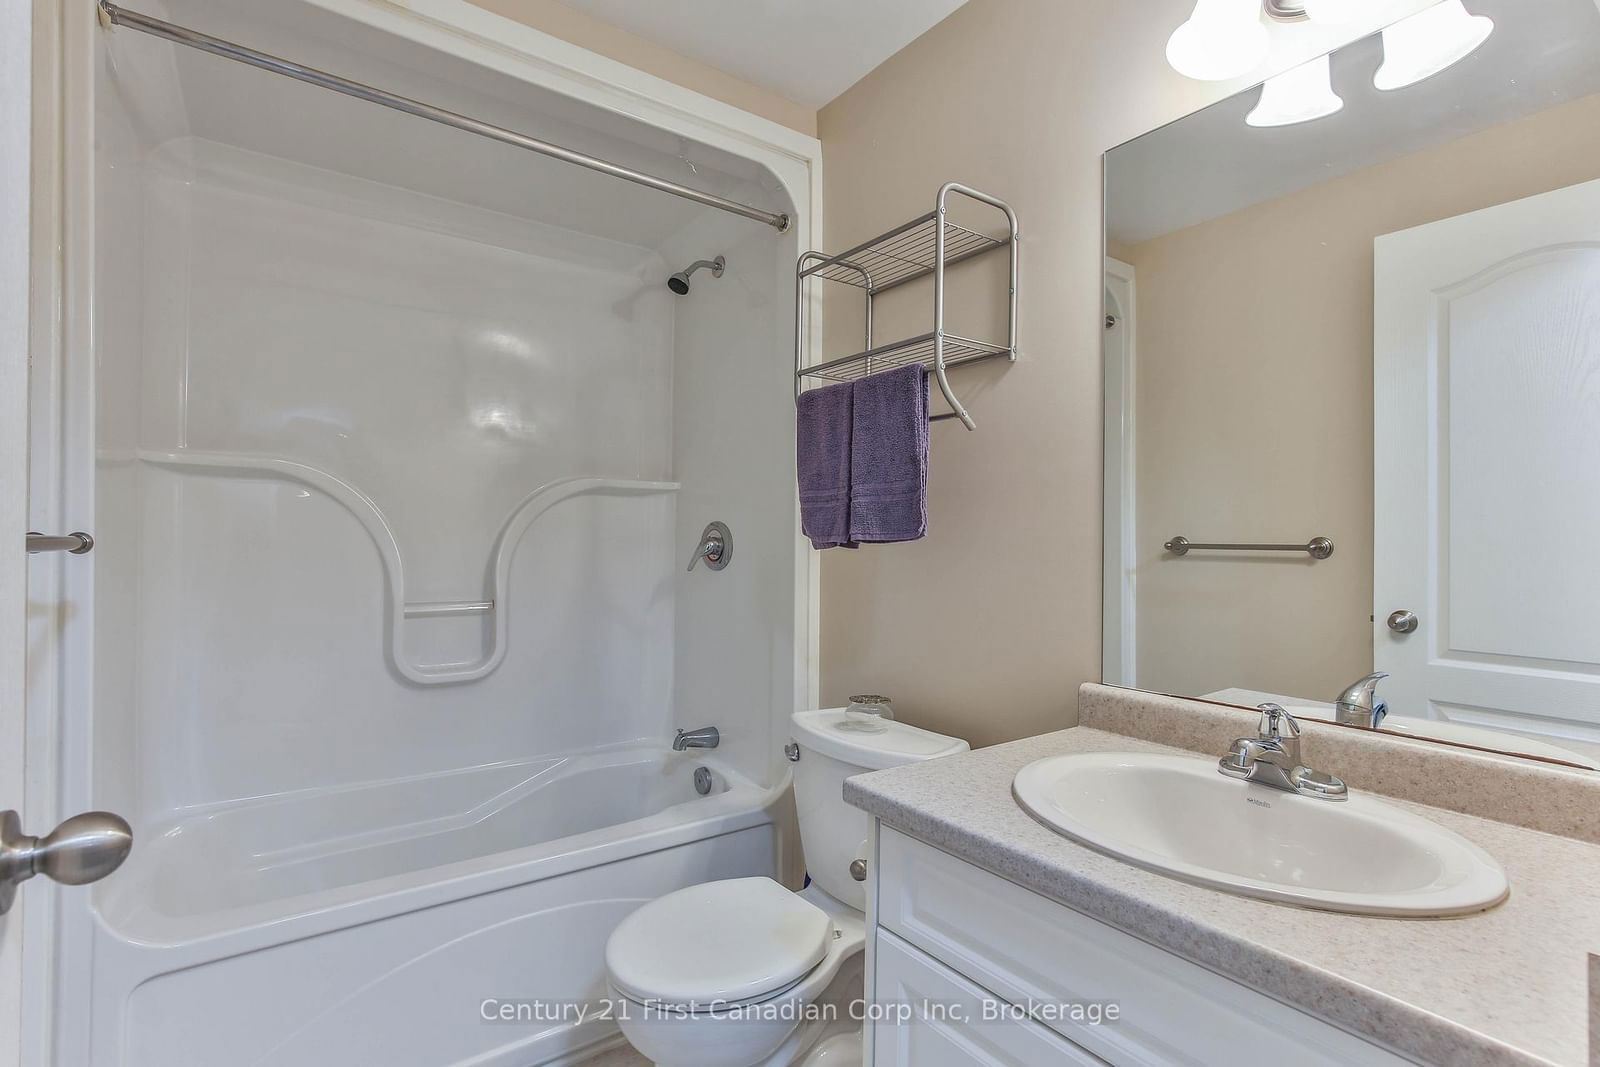
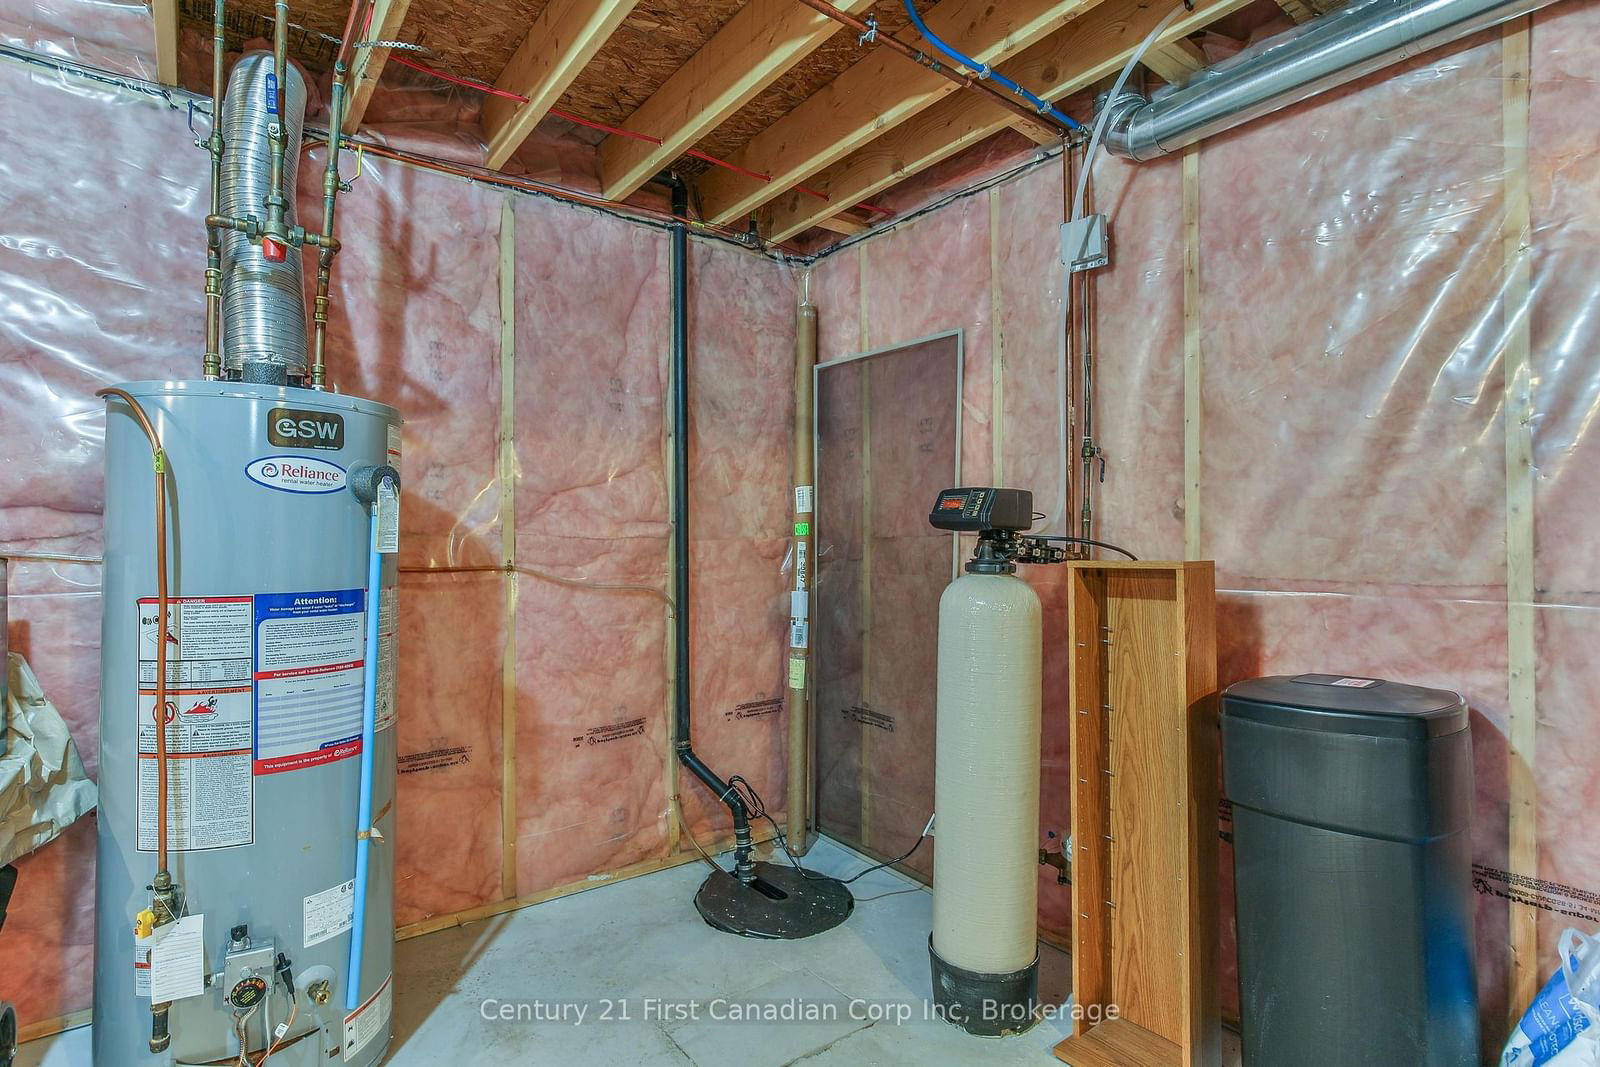
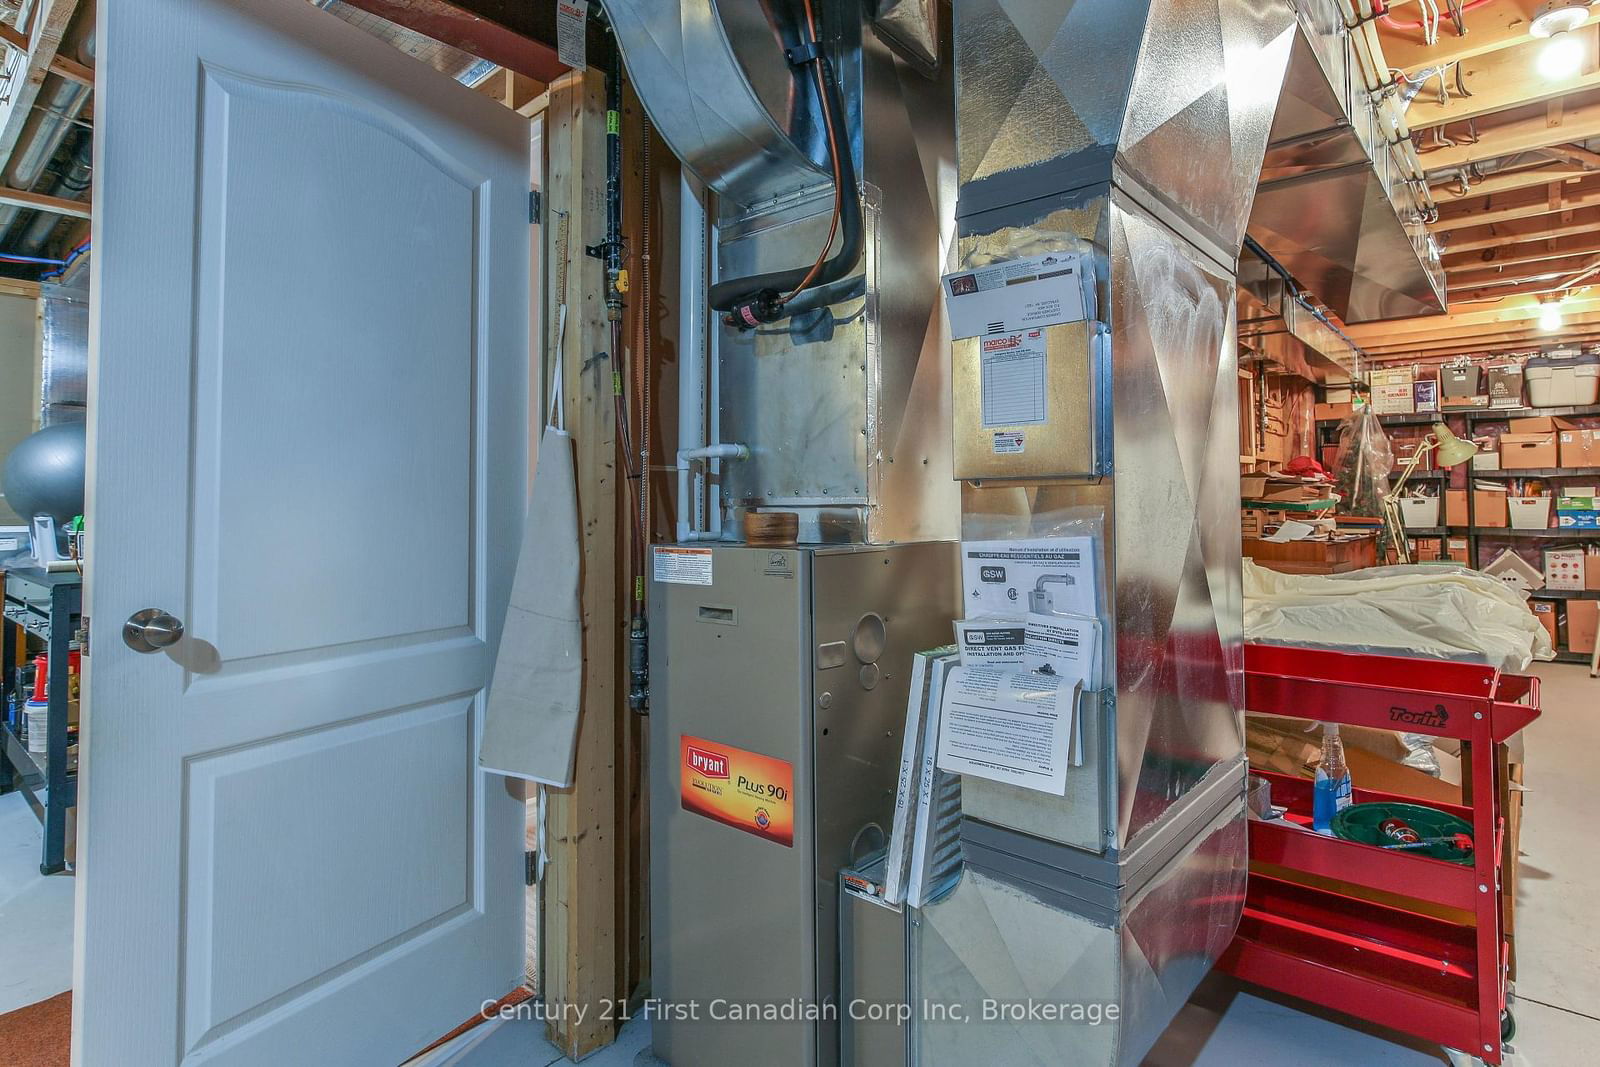
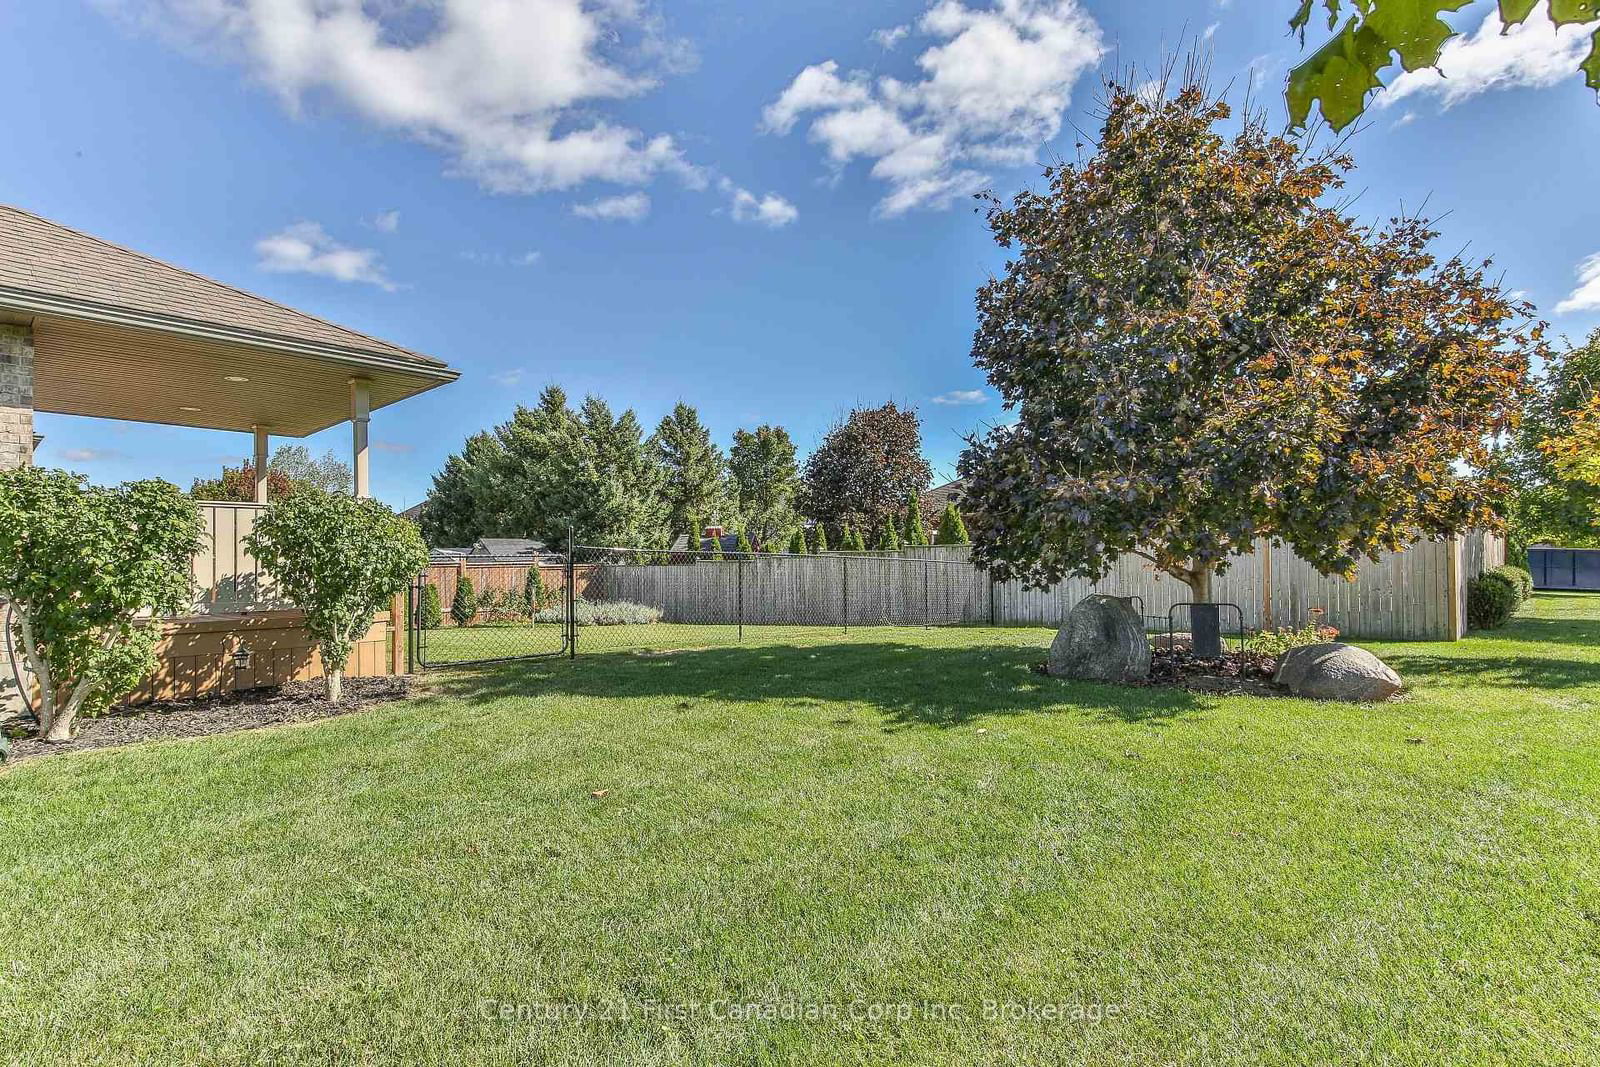
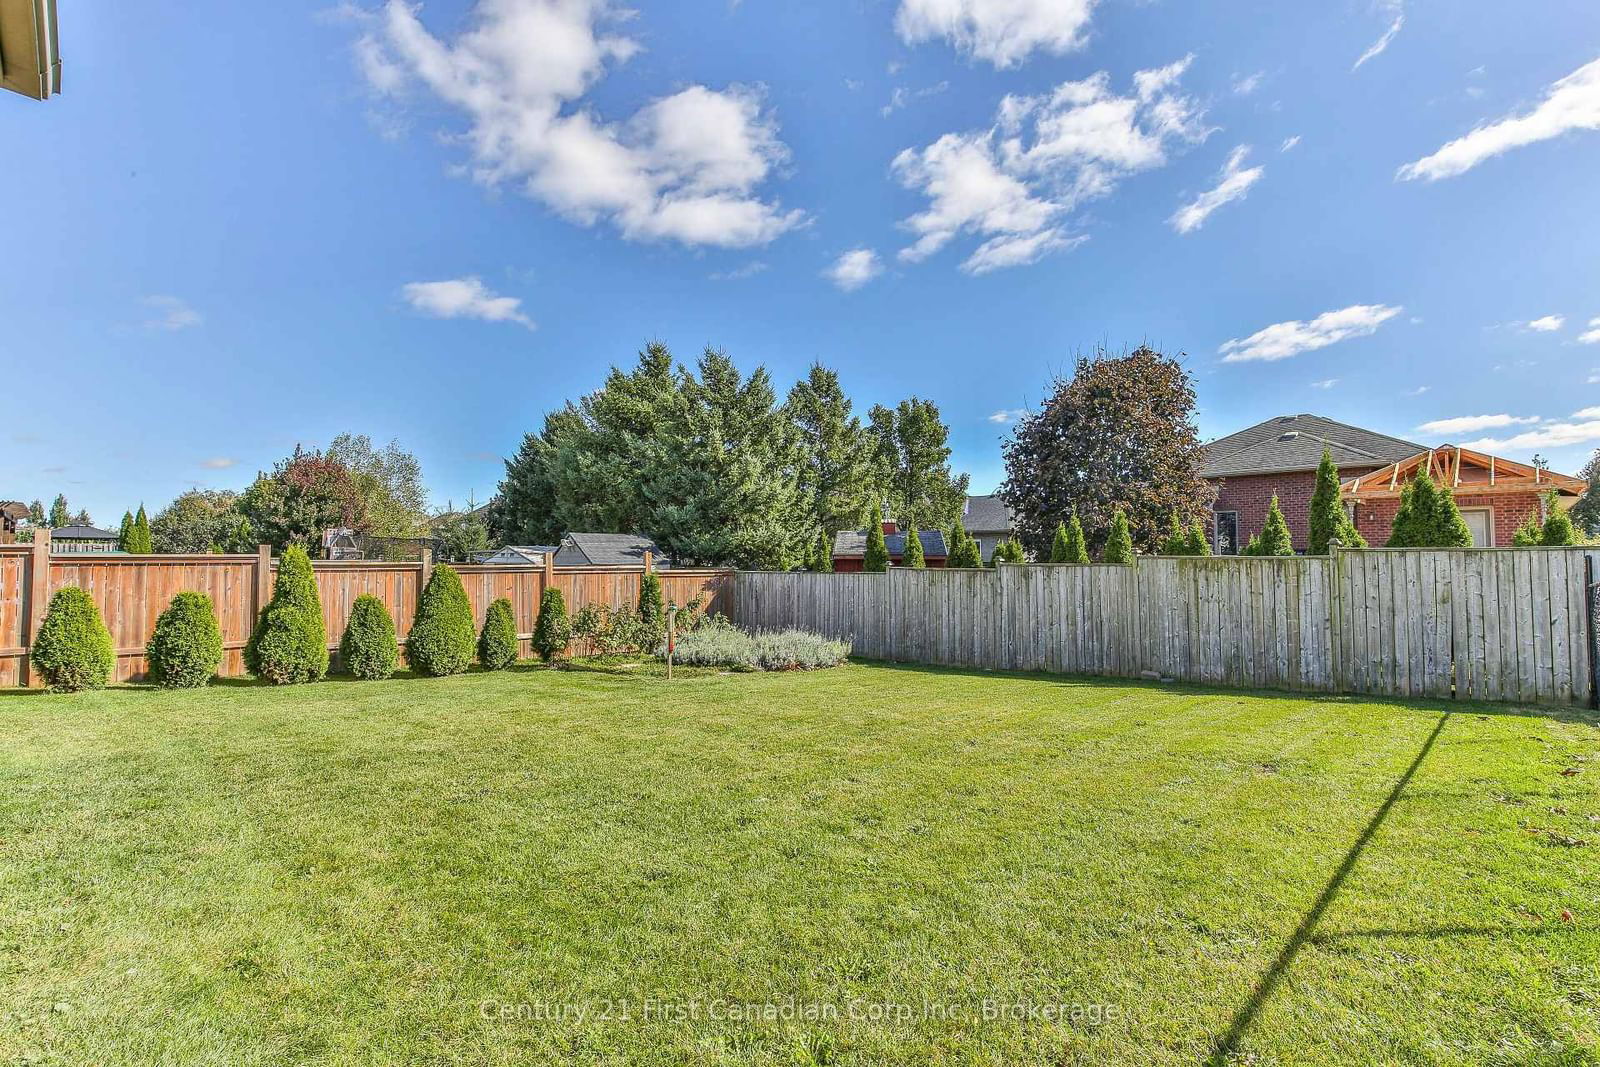
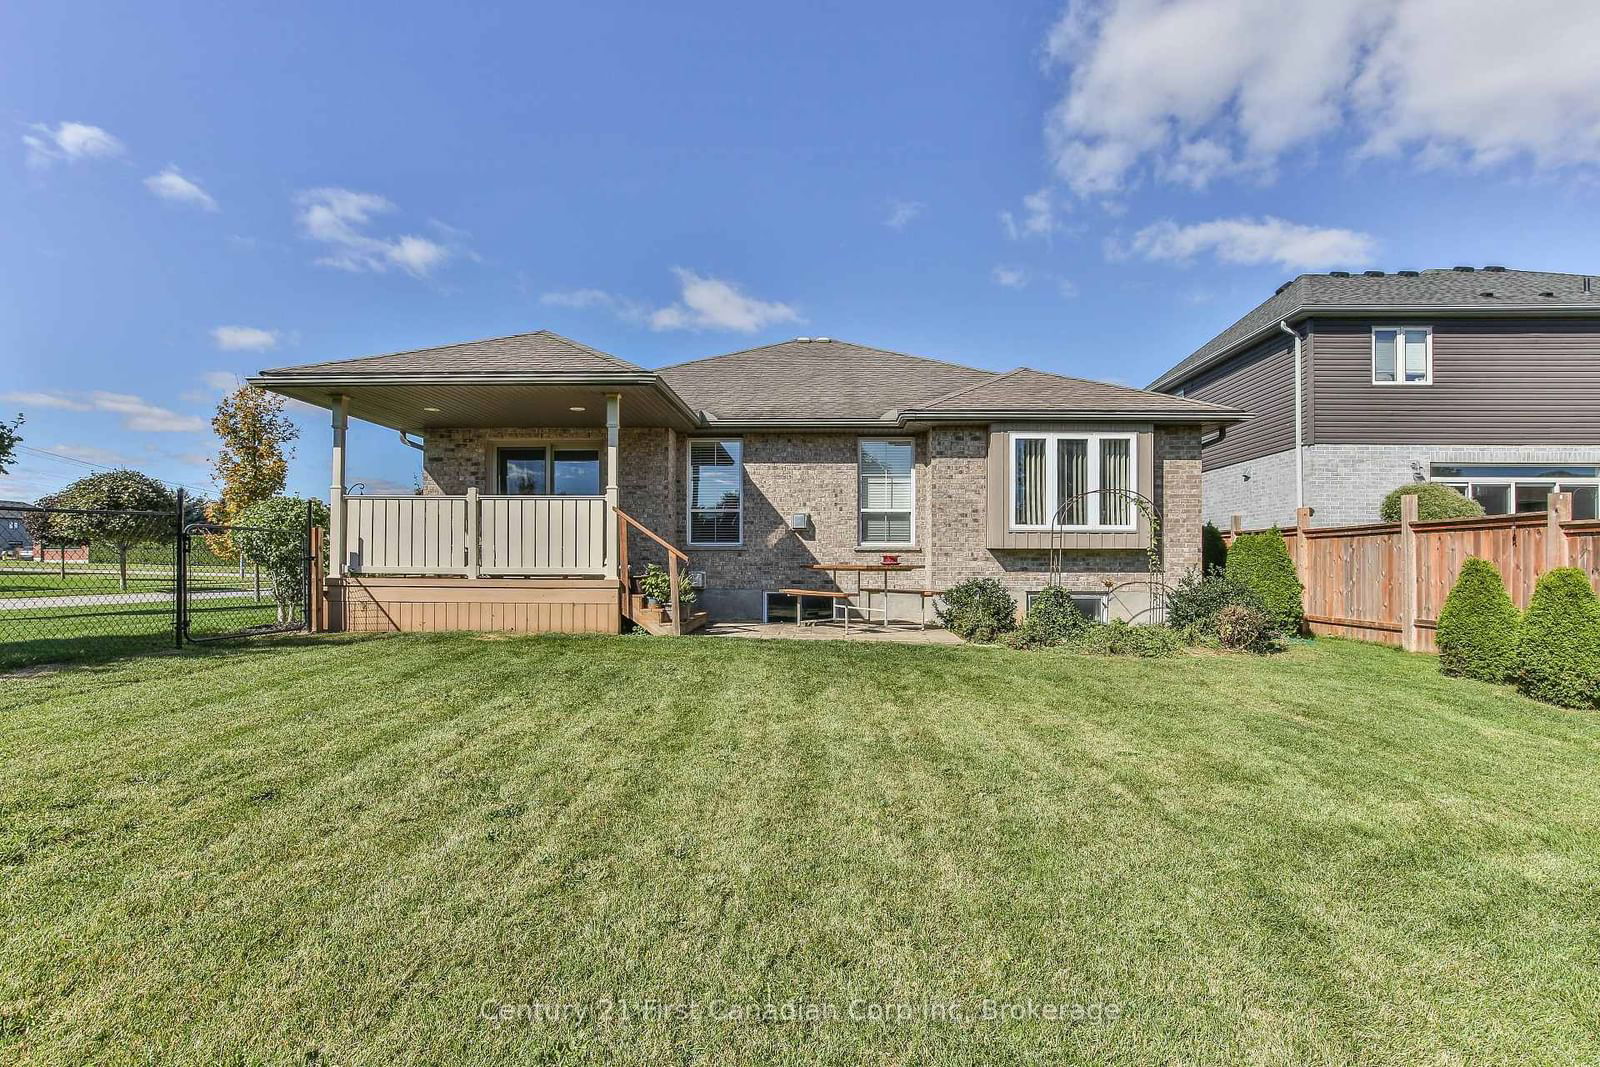
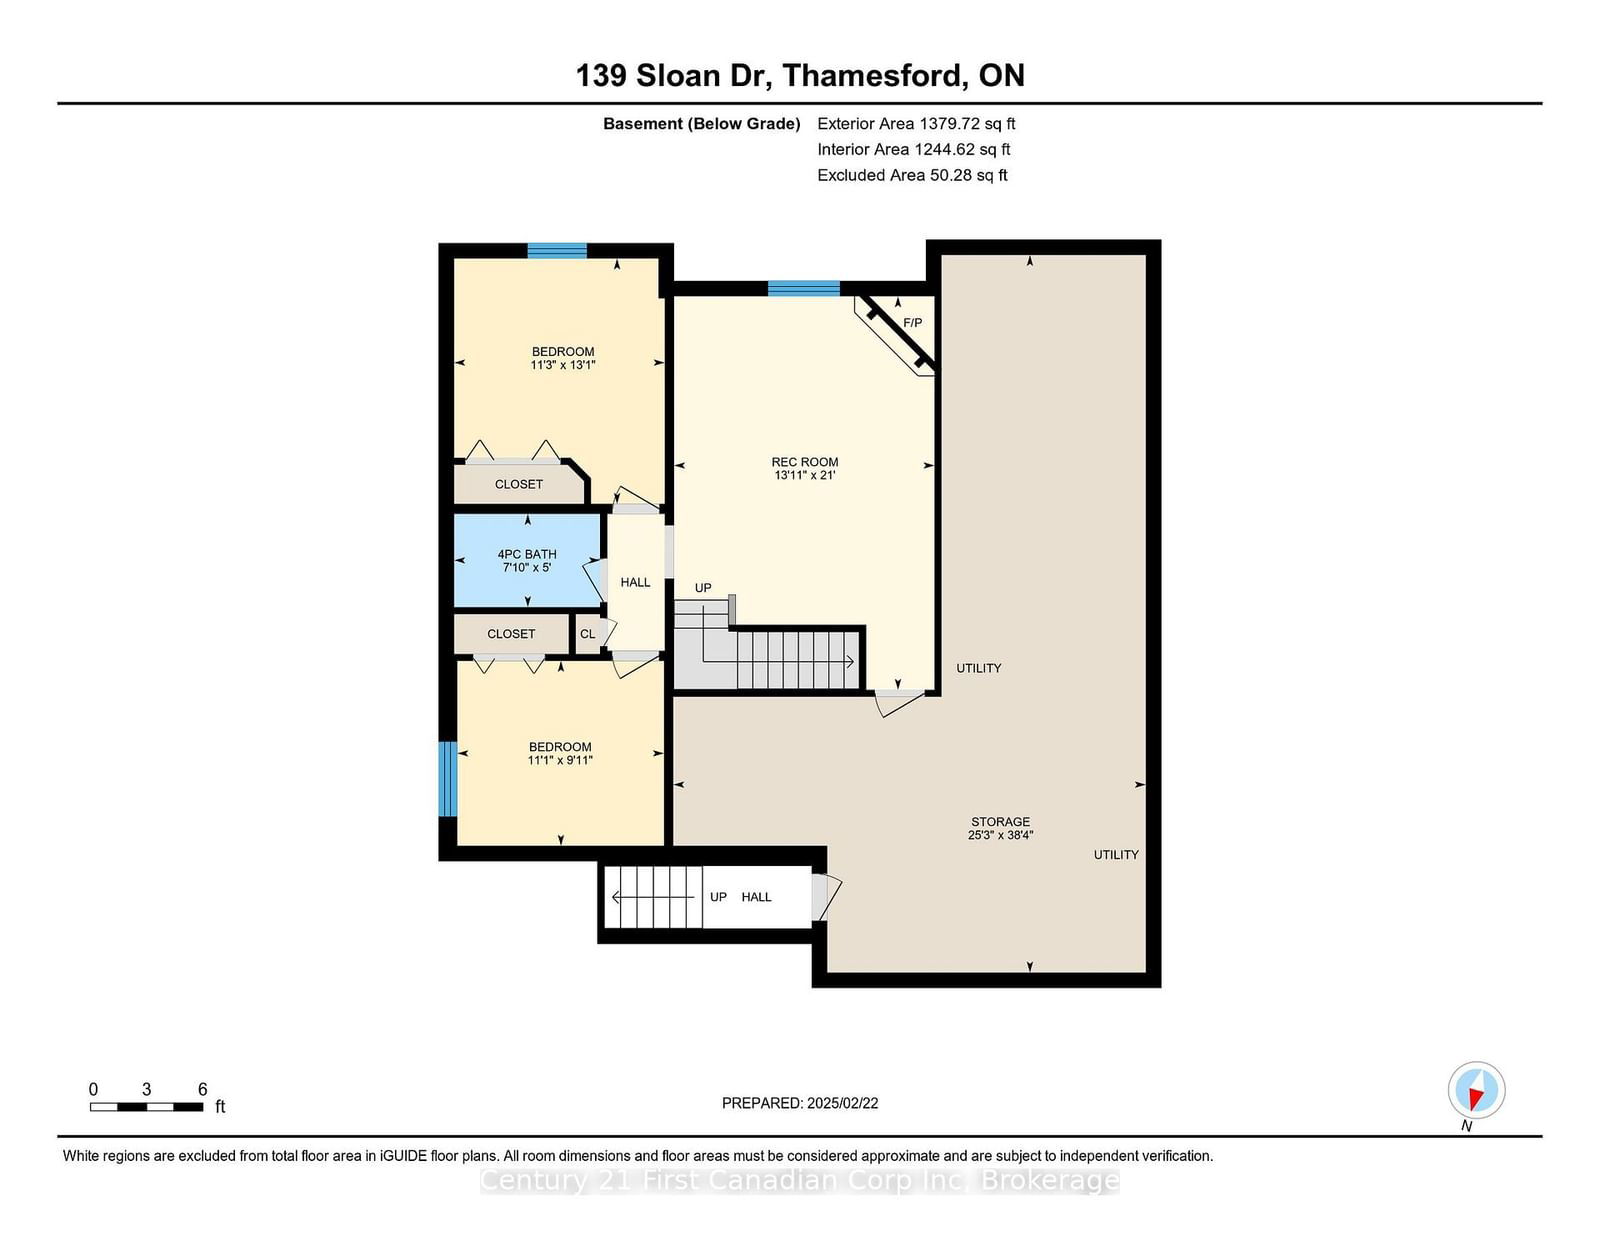
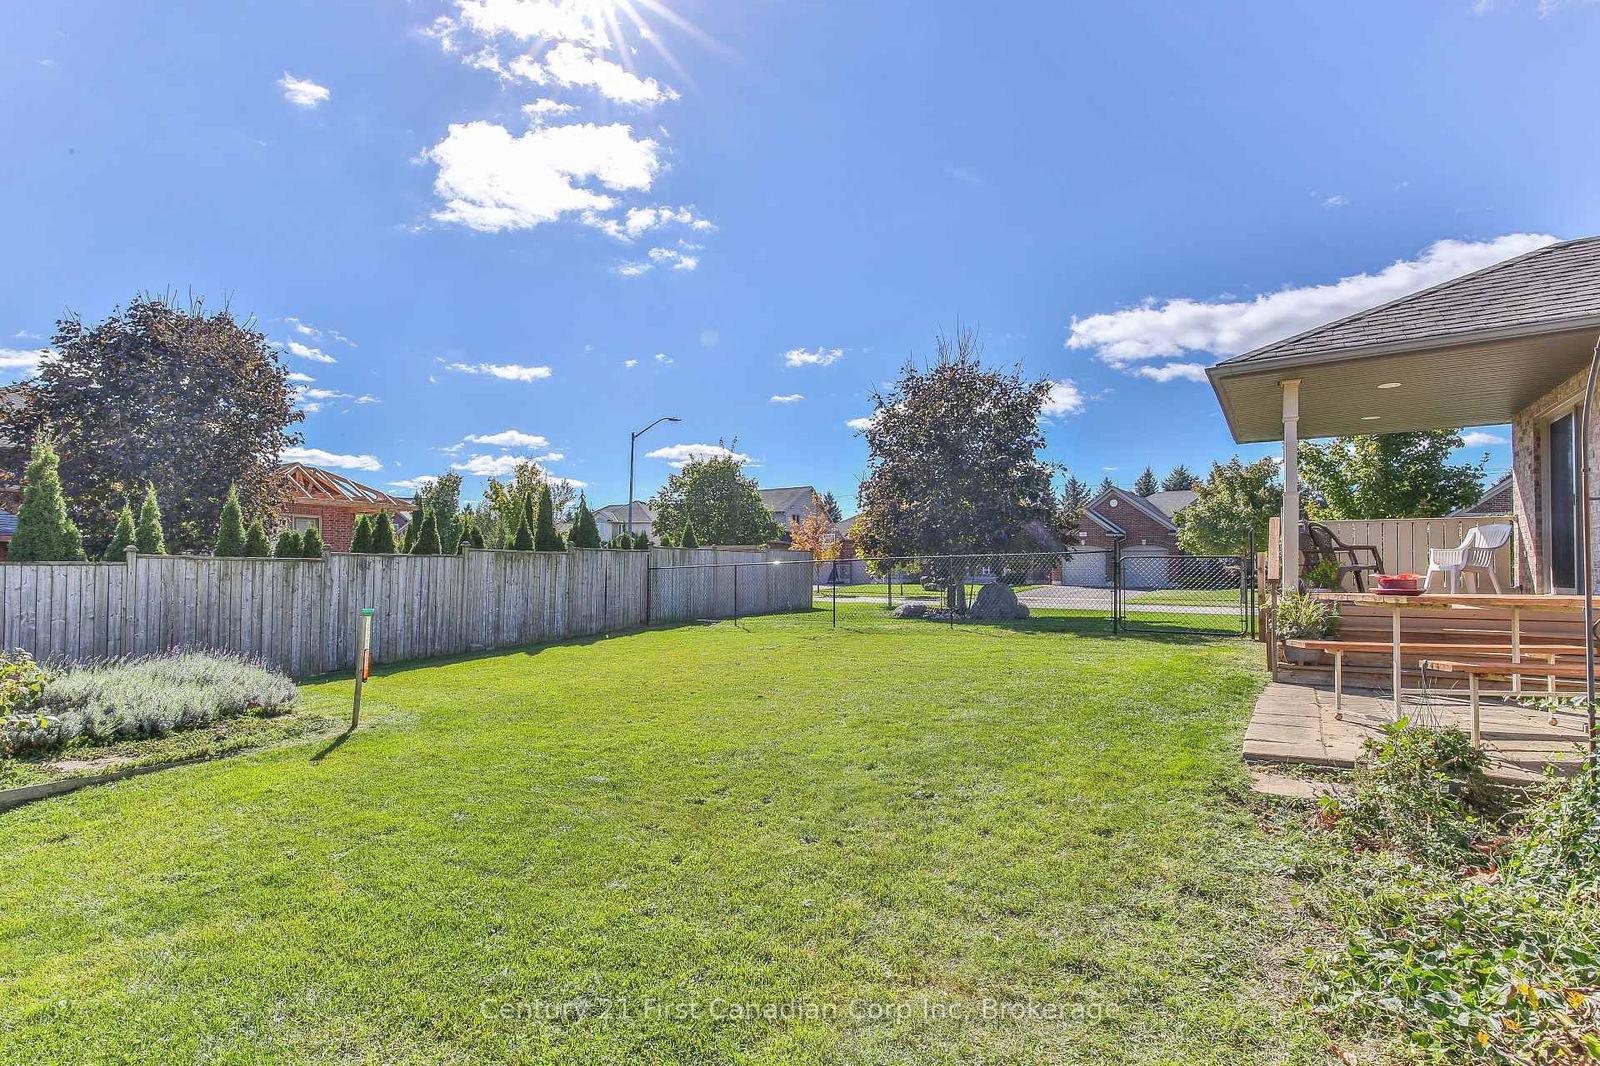
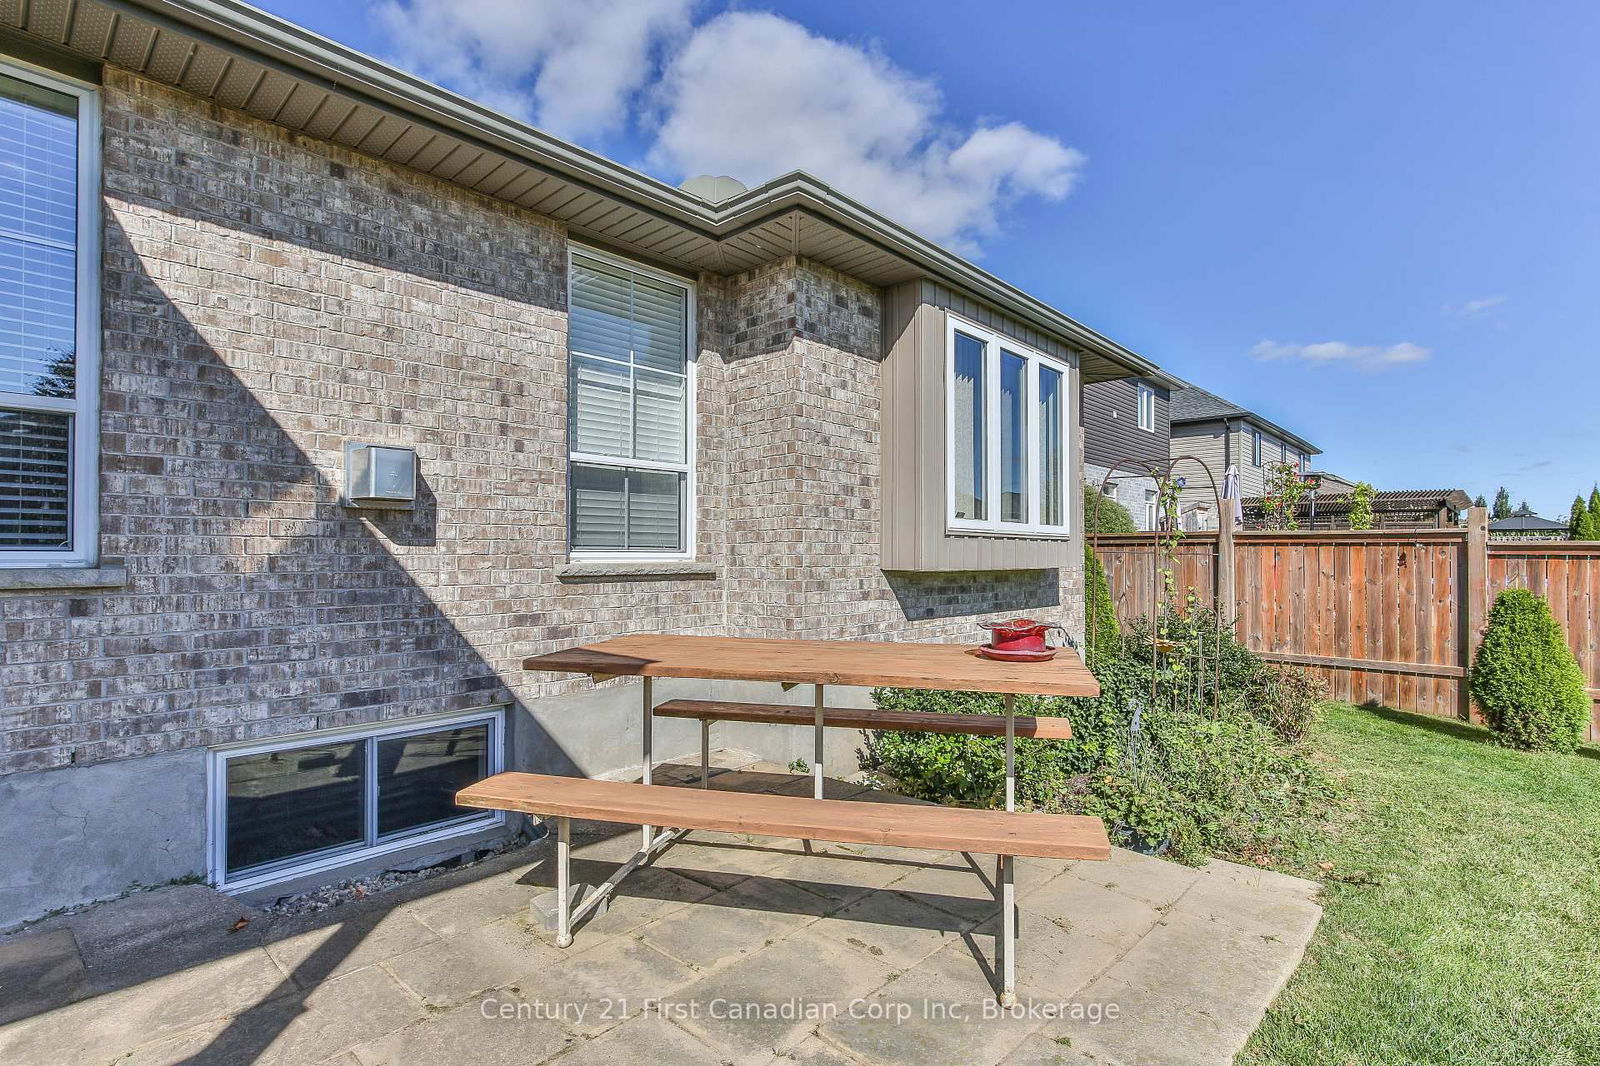
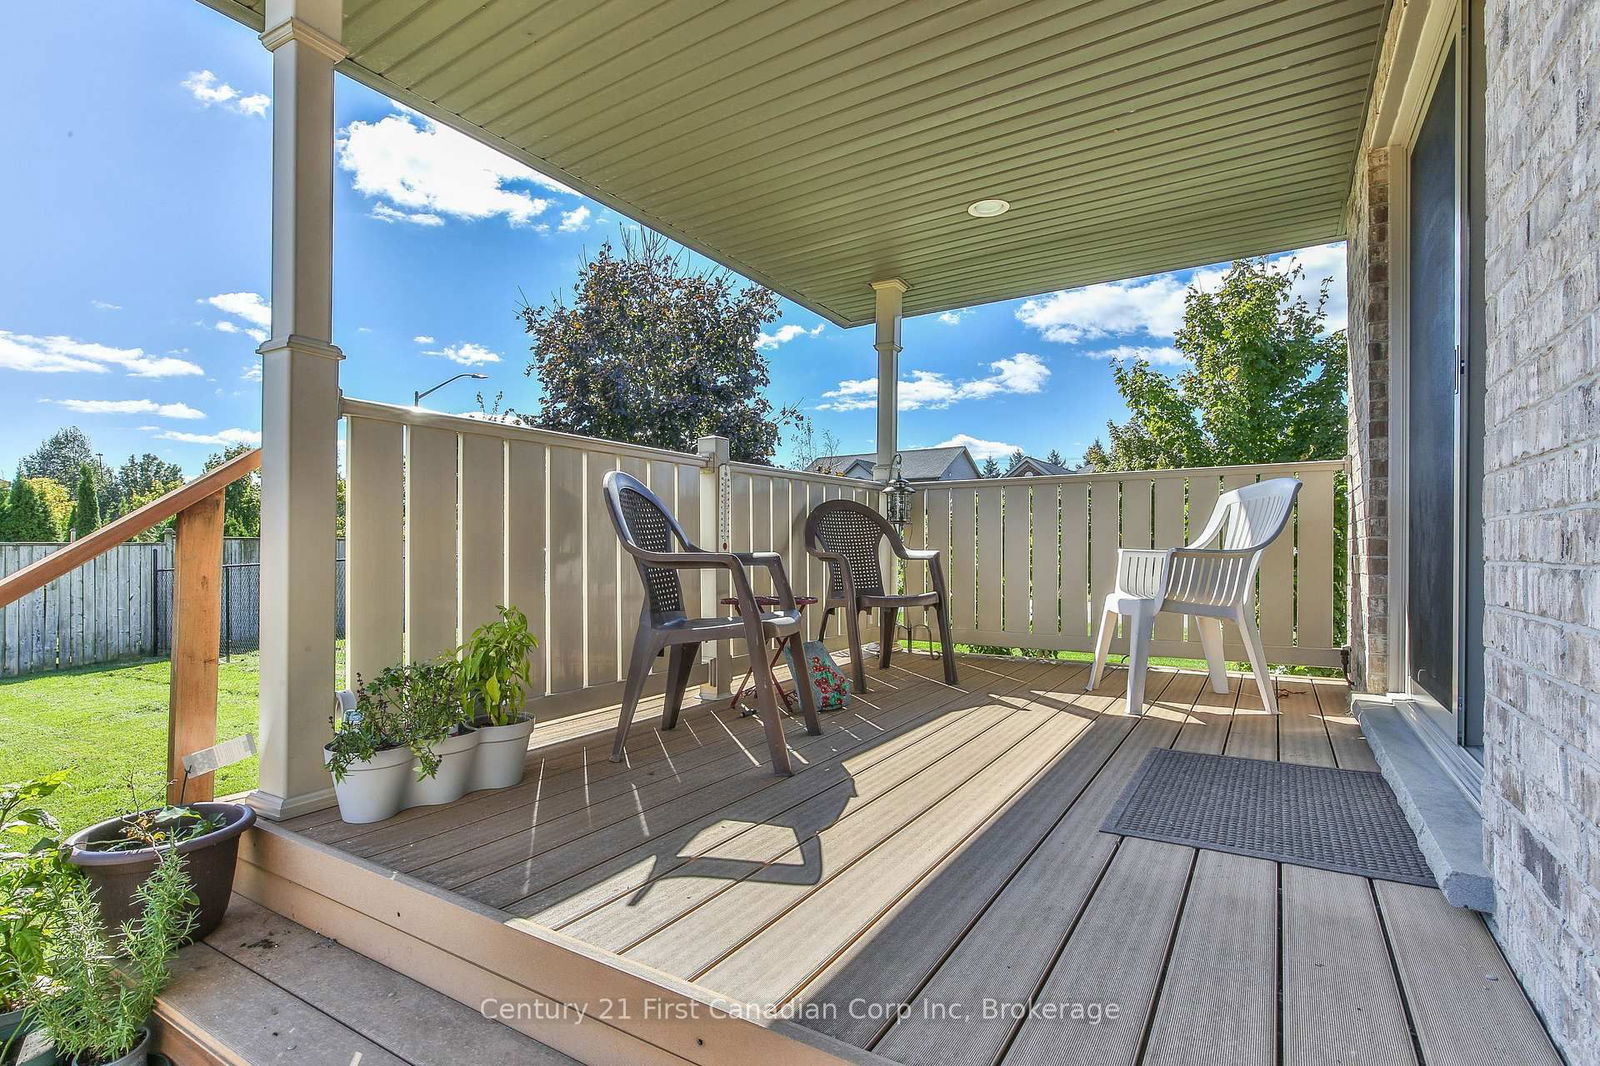
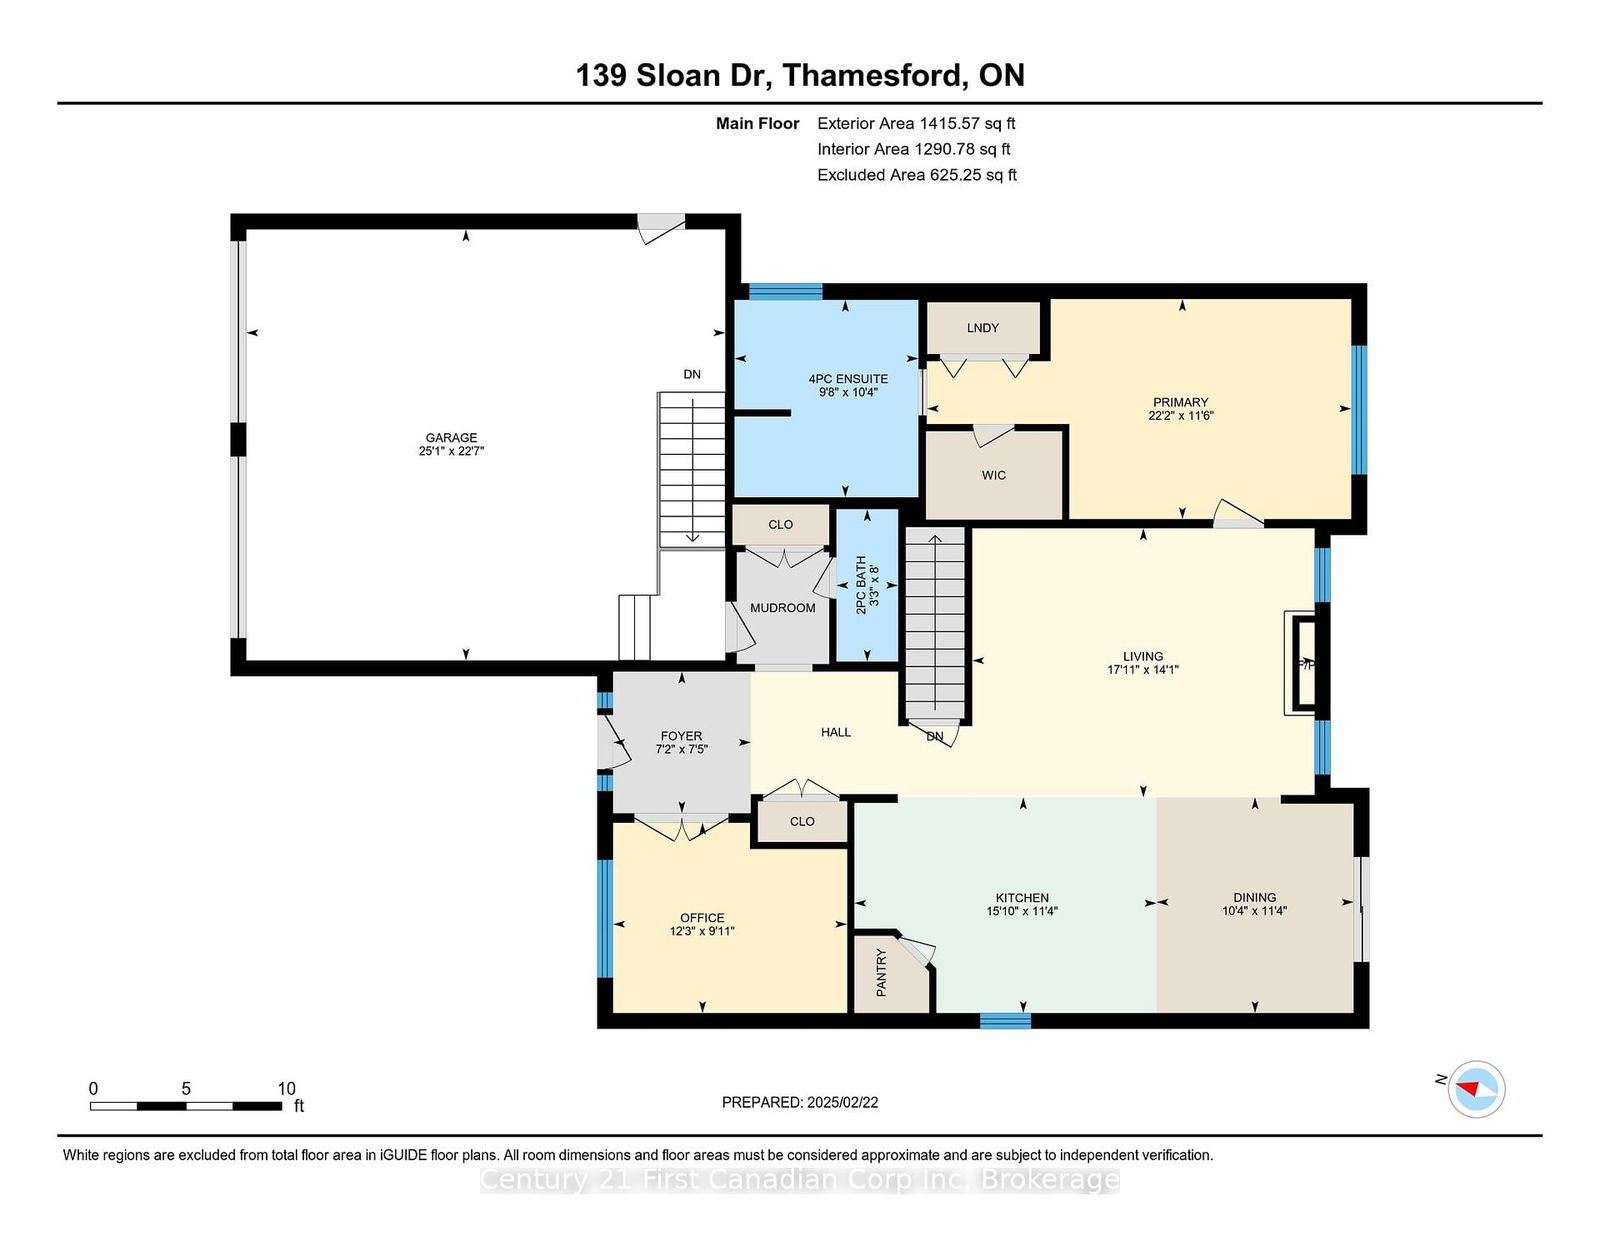
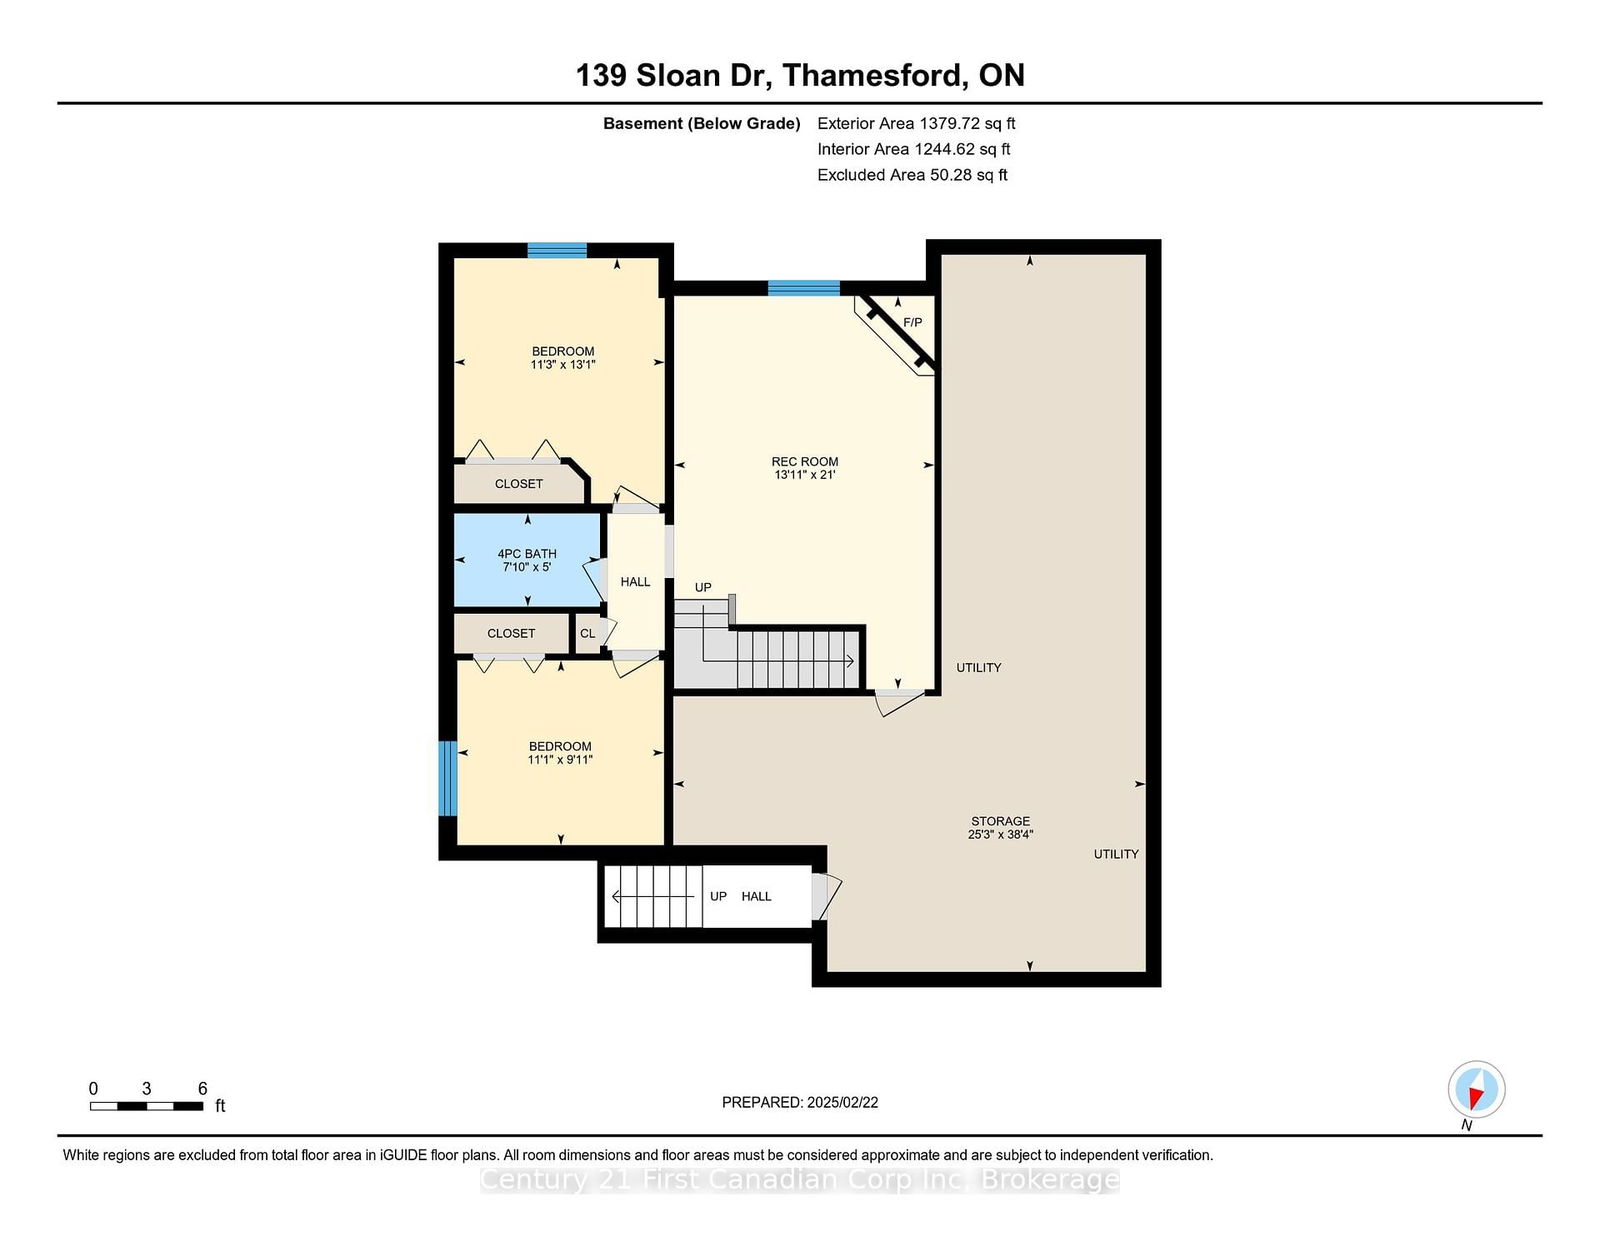
Welcome to 139 Sloan Dr! This well cared for 1416 sq ft bungalow is nestled on a large 66x133 ft corner lot. Enjoy watching the sunsets from the covered north facing front porch and the sunrises from the covered composite back deck. Oversized 22.6x25.1 ft garage offers plenty of room for your larger vehicles and has a basement walk-up for quick basement access and future potential in-law suite (With Township approval). Large asphalt driveway has room for 6 cars. Main floor offers a front bedroom that makes a great office or den, open concept living space with tray ceiling and fireplace in the living room, kitchen has an island with breakfast bar and corner pantry/bonus pantry off the fridge end and patio doors off the dining room to the composite deck and fully fenced yard. Primary bedroom is 22.2x11.6 with a walk-in closet, in suite laundry and a 4 pc ensuite with soaker tub and separate shower with seat. Downstairs has 2 bedrooms, 4 pc bath, family room with fireplace and plenty of room for a workshop, gym etc with 851 unfinished sq ft to work with- with direct stairs to the garage. There's walking trails and pond to enjoy in the neighbourhood and its close to the community centre (try our pickle ball leagues or come watch a Trojans hockey game), soccer fields, park/splash pad, skate park and beach volleyball courts. Thamesford also has an off leash dog park for fur babies to enjoy! Central to London, Woodstock, Stratford and mins to the 401. *fall photos included to better show the property without snow
dishwasher, water softener, R/O water treatment, window coverings, other appliances are negotiable
Foyer
2nd Br
Br
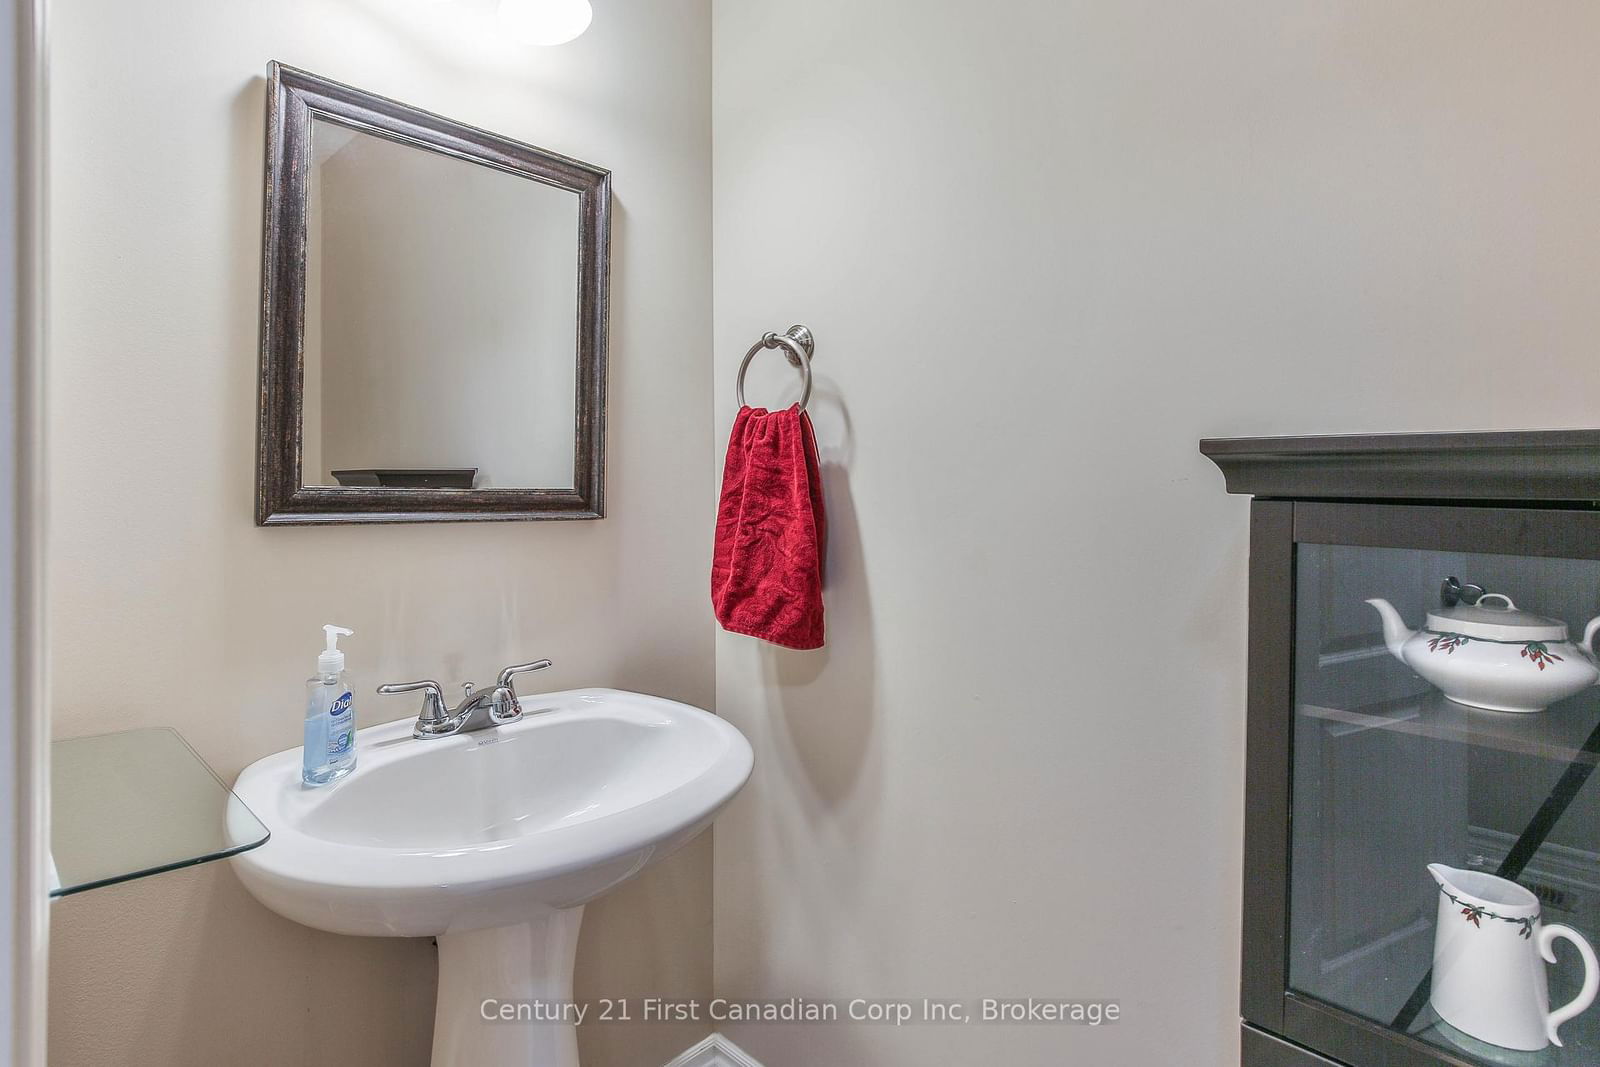
Bathroom
Living
Kitchen
Dining
Bathroom
3rd Br
4th Br
Bathroom
Family
Utility
The graph below compares the average list price and average sale price of homes in this neighborhood by month for the last 24 months. When average sale price is greater than average list price, this may suggest a buyer's market. When average sale price is lower than the average list price this may suggest a seller's market.
The graph below illustrates the average days on market for homes in this neighborhood. The yellow area may indicate a buyer's market, the green area may indicate a balanced market and the red area may indicate a seller's market.
Sales Representative, Century 21 People’s Choice Realty Inc., Brokerage
(647) 576 - 2100